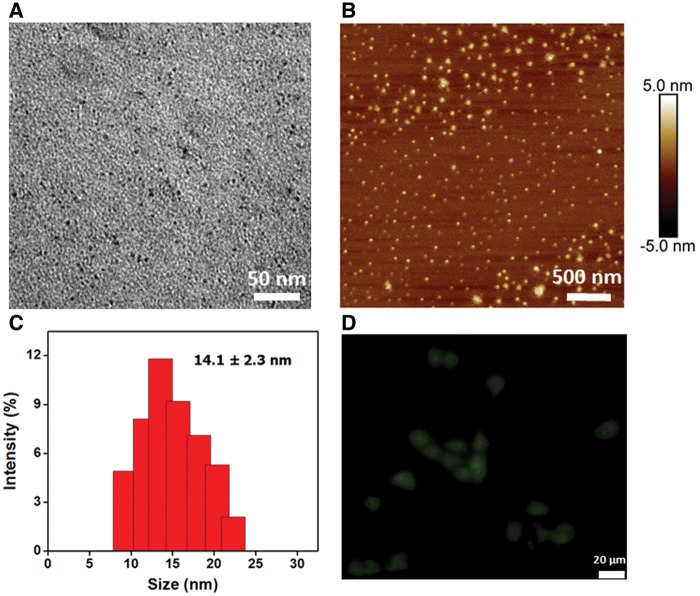
Figure 1.
Characterization of OH-GQDs nanoparticles. A, TEM image of OH-GQDs. Scale bar = 50 nm. B, AFM image of OH-GQDs. Scale bar = 500 nm. C, Hydrodynamic size of OH-GQDs in deionied water. D, Fluorescence image of HET-1A cells after treatment with OH-GQDs for 24 h. Scale bar = 20 μm. (For interpretation of the references to colour in this figure legend, the reader is referred to the web version of this article.)

