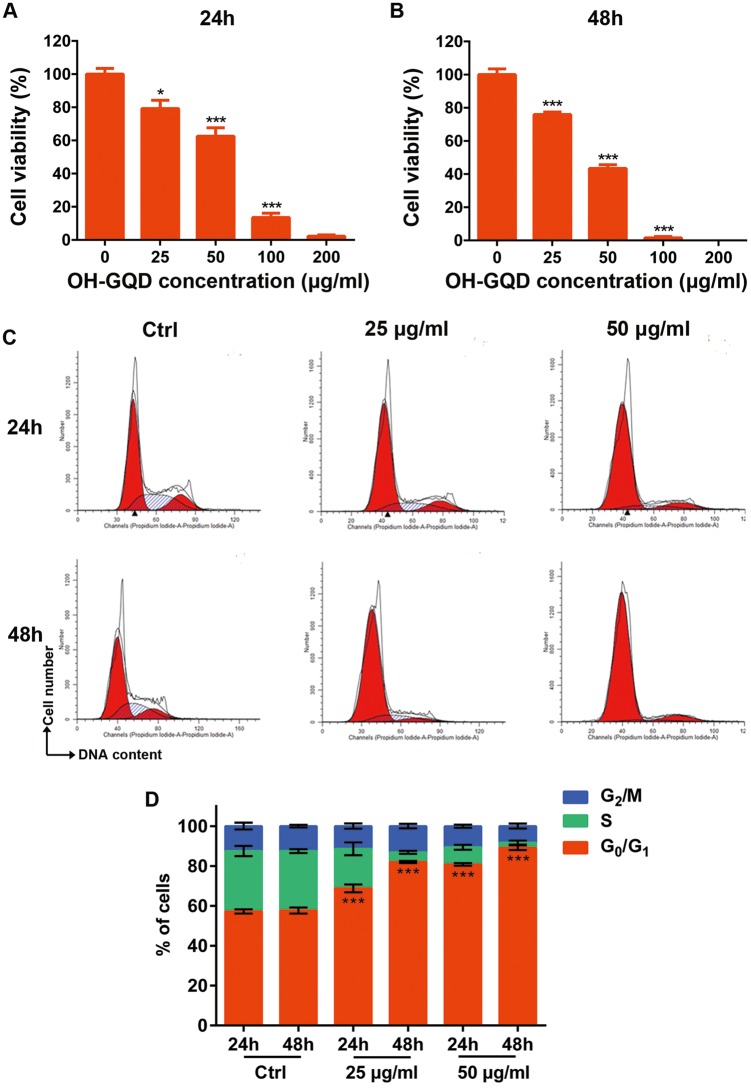
Figure 2.
The cytotoxicity of OH-GQDs and their effects on cell cycle distribution. (A and B) Cell viability after exposure to indicated concentration of OH-GQDs (0, 25, 50, 100, and 200 μg/ml) for 24 and 48 h, respectively. One-way ANOVA was performed and data are presented as mean ± SD, n = 5. When compared with 0 μg/ml OH-GQDs-treated cells, *p < .05, **p < .01, ***p < .001. (C and D) HET-1A cells were exposed to 25 and 50 μg/ml OH-GQDs for 24 or 48 h and cell cycle distribution was analyzed by flow cytometry. One-way ANOVA was performed. The data are presented as the mean ± SD from 3 tests. When compared with the control cells which were harvested at the same time point, *** p < .001.

