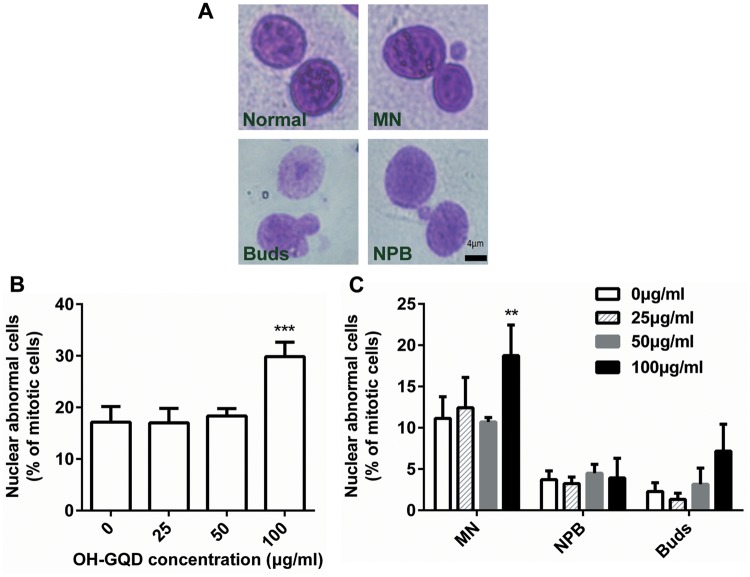
Figure 4.
Cytokinesis-blocked micronucleus formation in HET-1A cells exposed to OH-GQDs. A, Representative images of cells scored using the cytokinesis-blocked micronuleus assay: Normal cell, binucleated cell with micronucleus (MN), binucleated cell with buds (Buds) and binucleated cell with nucleoplasmic bridge (NPB). Scale bar = 4 μm. B, The percentage of nuclear abnormal cells in mitotic cells were counted and represented as mean ± SD from 3 tests. One-way ANOVA was performed. When compared with 0 μg/ml OH-GQDs-treated cells, *** p < .001. C, The percentage of nuclear abnormal cells with MN, NPB, and Buds in mitotic cells were counted separately and represented as mean ± SD. One-way ANOVA was performed. When compared with 0 μg/ml OH-GQDs-treated cells, **p < .01.

