Figure 5.
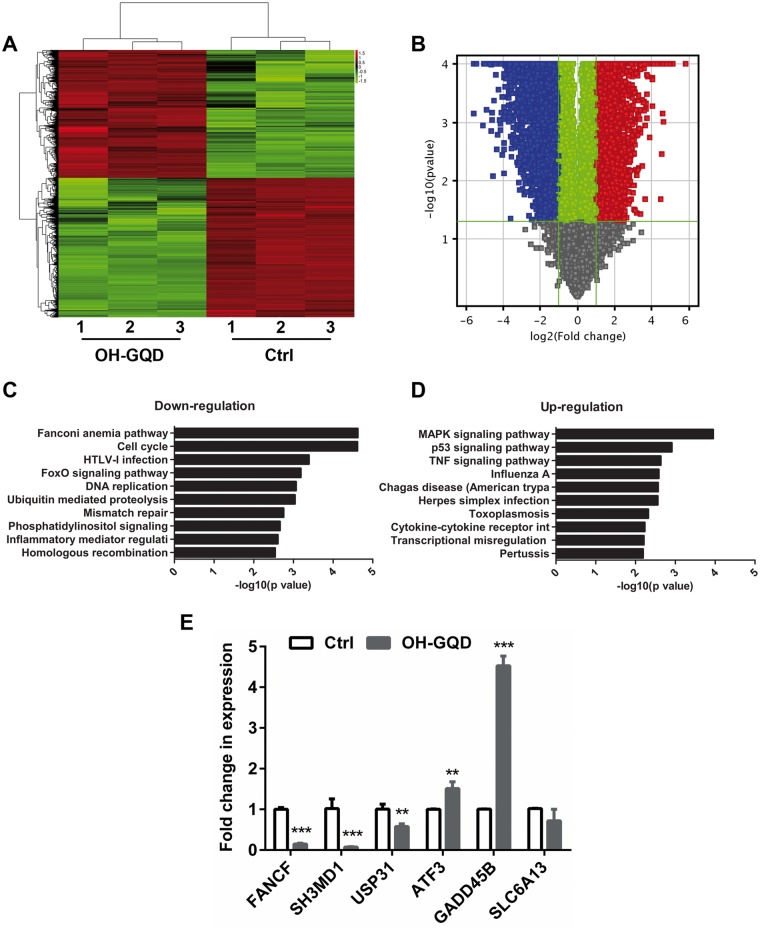
Significant pathways altered in OH-GQDs-treated human esophageal epithelial cells. A, Clustering map of genes differentially expressed in OH-GQDs-treated and control HET-1A cells. B, Volcano plot comparing vehicle treatment versus OH-GQDs treatment. C and D, Significant pathways altered in OH-GQDs treated and control HET-1A cells. E, Quantitative real-time PCR validation for selected genes between OH-GQDs treated and control cells (n = 3). Student’s t test was performed. When compared with control cells, **p < .01, *** p < .001. (For interpretation of the references to colour in this figure legend, the reader is referred to the web version of this article.)

