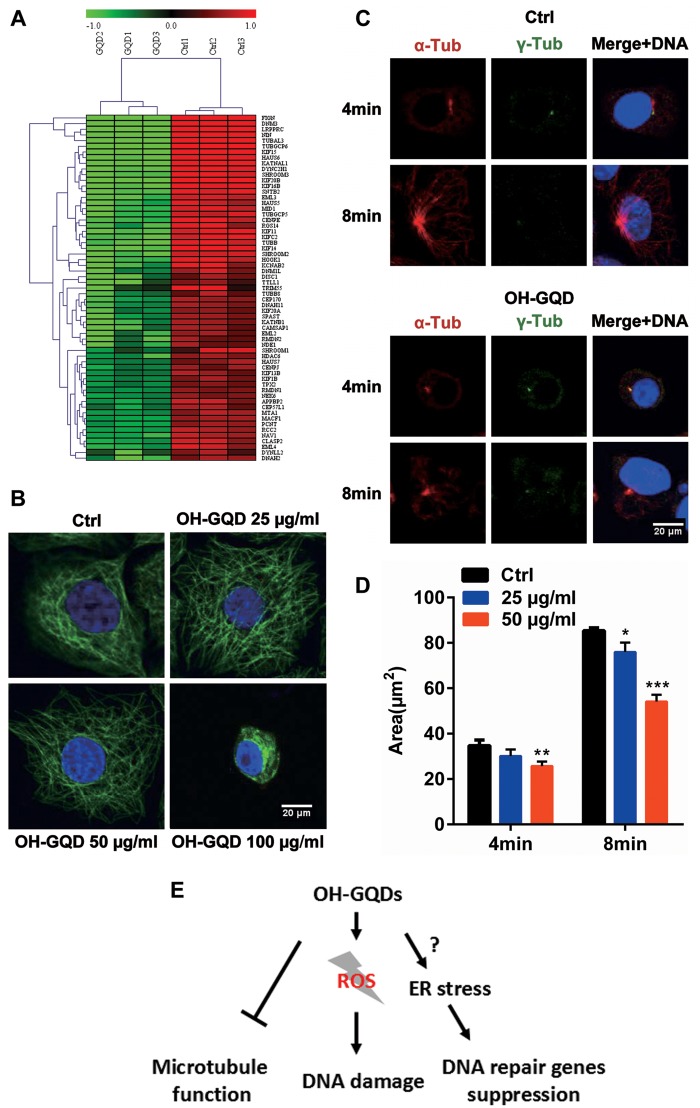
Figure 7.
OH-GQDs treatment disrupted microtubule structure and suppressed microtubule regrowth around centrosomes. A, Differentially expressed genes related to tubulin functions in response to OH-GQDs treatment. B, HET-1A cells were exposed to the indicated concentration (0, 25, 50, and 100 μg/ml) of OH-GQDs for 24 h. Cells were fixed and stained with anti-α-tubulin antibody to visualize microtubules (green) and DAPI to visualize the nucleus (blue). Scale bar = 20 μm. C, The HET-1A cells were treated with chilled medium + 1 μg/ml nocodazole for 1 h on the ice. Microtubule nucleation and regrowth were detected at the indicated time post nocodazole removal in 25 and 50 μg/ml OH-GQDs treated and control cells. Scale bar = 20 μm. D, The area of microtubule around the centrosomes was measured and quantitative data are represented as mean ± SD from 3 tests (n ≥ 50). One-way ANOVA was performed. When compared with control cells, *p < .05, **p < .01, ***p < .001. E, The OH-GQDs exhibit significant cytotoxic effects via increasing DNA damage, suppressing the expression of DNA damage repair genes and disturbing microtubule function. (For interpretation of the references to colour in this figure legend, the reader is referred to the web version of this article.)

