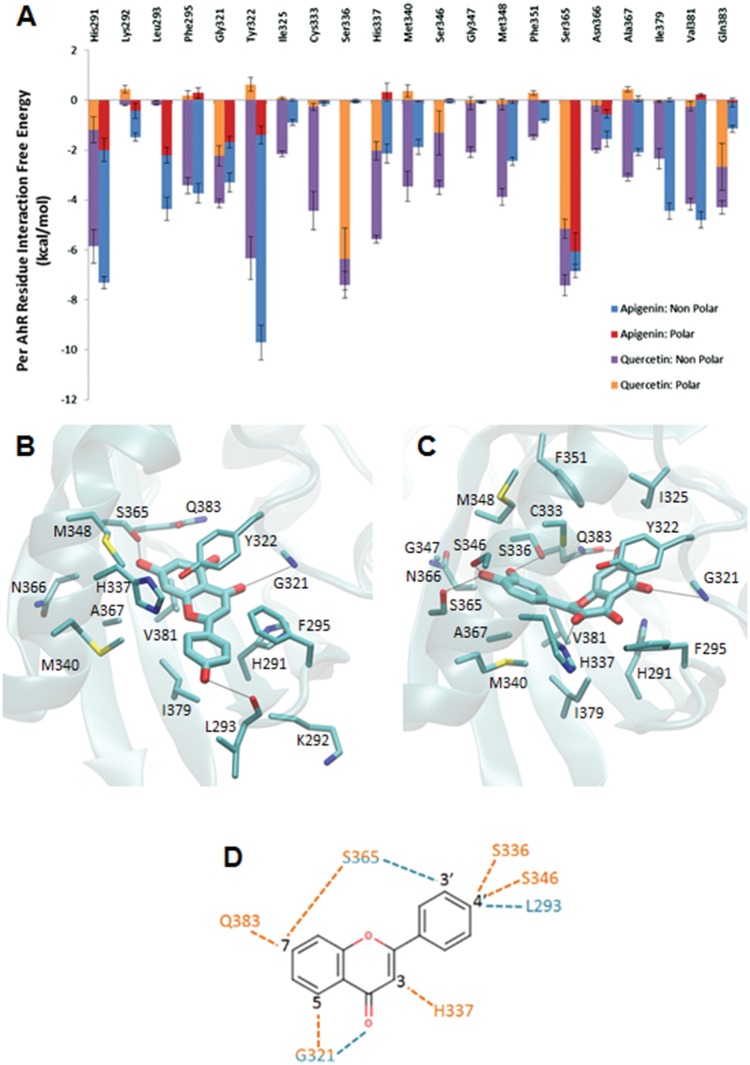
Figure 4.
A, Average interaction-free energies (kcal/mol) decomposed into polar (orange or red) and non-polar (purple or blue) components for AhR interacting residues in complex with quercetin (first bar per residue), and in complex with apigenin (second bar per residue). The sum of the polar and non-polar components corresponds to the total average per AhR residue interaction-free energy. Only per residue interactions with total interaction free energies less than −1.0 kcal/mol are considered in the plot. The average polar and non-polar interaction-free energy component values and their standard deviation values were calculated over 4 measurements in which the first, second, third, and fourth measurement correspond to the individual average interaction-free energy component of the first, second, third, and fourth 12.5 ns segment of the 50 ns MD simulation production run. Molecular graphics images of (B) the lowest association-free energy binding mode of the quercetin: AhR complex and (C) the lowest association-free energy binding mode of apigenin: AhR complex. For both panels, the ligand is shown in licorice representation, AhR is shown in transparent cyan new cartoon representation, and key residues are shown in thin licorice representation. D, 2D diagram of hydroxyl group positions of quercetin and apigenin. The quercetin molecule has hydroxyl groups at positions 3, 5, 7, 3′, and 4′. The apigenin molecule has hydroxyl groups at positions 5, 7, and 4′. Dotted lines indicate hydrogen bonds to AhR residues. Residue names and dotted lines colored orange indicate interactions to quercetin. Residue names and dotted lines colored cyan indicate interactions to apigenin.

