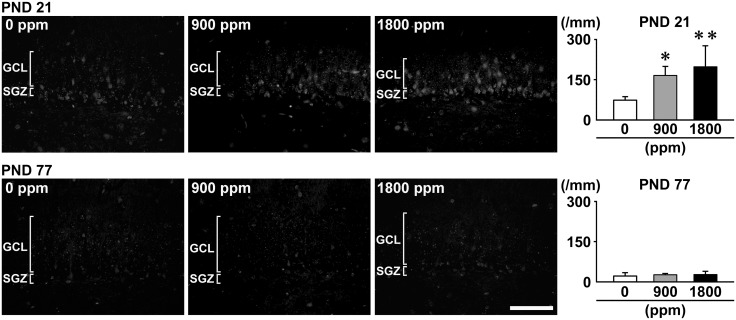
Figure 6.
Distribution of Morin+ cells in the SGZ/GCL of the hippocampal dentate gyrus of male offspring at PND 21 and PND 77 after maternal exposure to aluminum chloride (AlCL3) from GD 6 to PND 21. Representative images from the 0-ppm controls (left) and the 900-ppm (middle) and 1800-ppm (right) AlCL3 groups at PND 21. Magnification ×400; bar 50 μm. Graphs show the numbers of Morin+ cells in the GCL. N = 5/group. *p < .05, **p < .01, compared with the 0-ppm controls by Dunnett’s test or Aspin-Welch’s t-test with Bonferroni correction.

