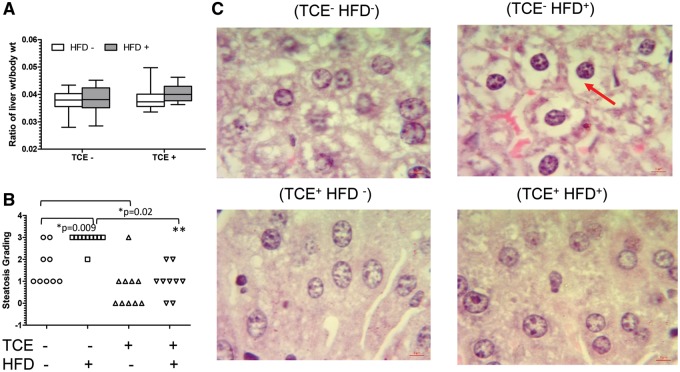
Figure 3.
TCE-inhibited HFD-mediated steatosis-like liver pathology. Liver tissues were collected from female offspring at study terminus. A, Liver weights (g) are presented in graphs (mean [SD]). B, Liver was processed as described in the “Materials and Methods” section and scored to evaluate steatosis and represented as mean (SD). Each plot in the graph represents a liver sample from a single mouse within each group. C, Representative H&E staining of liver samples (100× oil immersion). The red arrow points to fat deposits which are largely absent in TCE groups. Results are statistically significant (*p < .05 and **p < .001).

