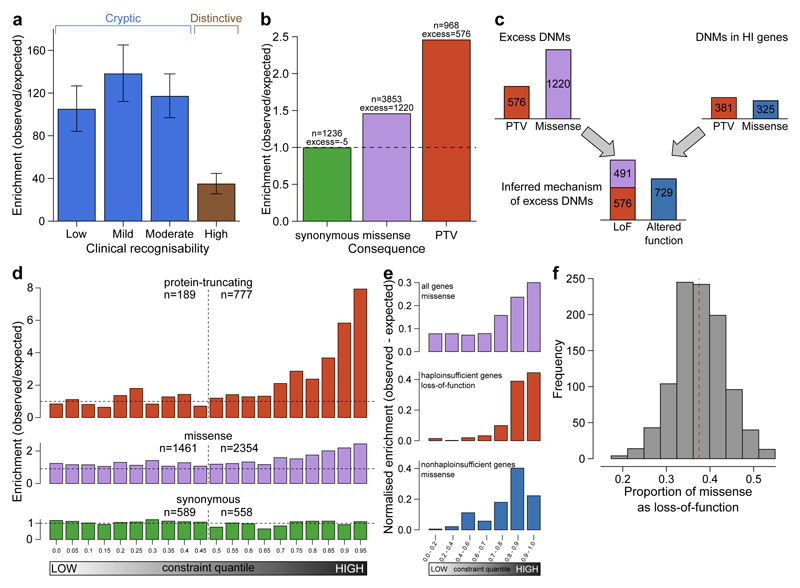
Figure 3.
Excess of de novo mutations (DNMs). a, Enrichment ratios of observed to expected loss-of-function DNMs by clinical recognisability for dominant haploinsufficient neurodevelopmental genes as judged by two consultant clinical geneticists. Error bars indiciate 95% CI. b, Enrichment of DNMs by consequence normalised relative to the number of synonymous DNMs. c, Proportion of excess DNMs with loss-of-function or altered-function mechanisms. Proportions are derived from numbers of excess DNMs by consequence, and numbers of excess truncating and missense DNMs in dominant haploinsufficient genes. d, Enrichment ratios of observed to expected DNMs by pLI constraint quantile for loss-of-function, missense and synonymous DNMs. Counts of DNMs in each lower and upper half of the quantiles are provided. e, Normalised excess of observed to expected DNMs by pLI constraint quantile. This includes missense DNMs within all genes, loss-of-function including missense DNMs in dominant haploinsufficient genes and missense DNMs in dominant nonhaploinsufficient genes (genes with dominant negative or activating mechanisms). f, Proportion of excess missense DNMs with a loss-of-function mechanism. The red dashed line indicates the proportion in observed excess DNMs at the optimal goodness-of-fit. The histogram shows the frequencies of estimated proportions from 1000 permutations, assuming the observed proportion is correct.

