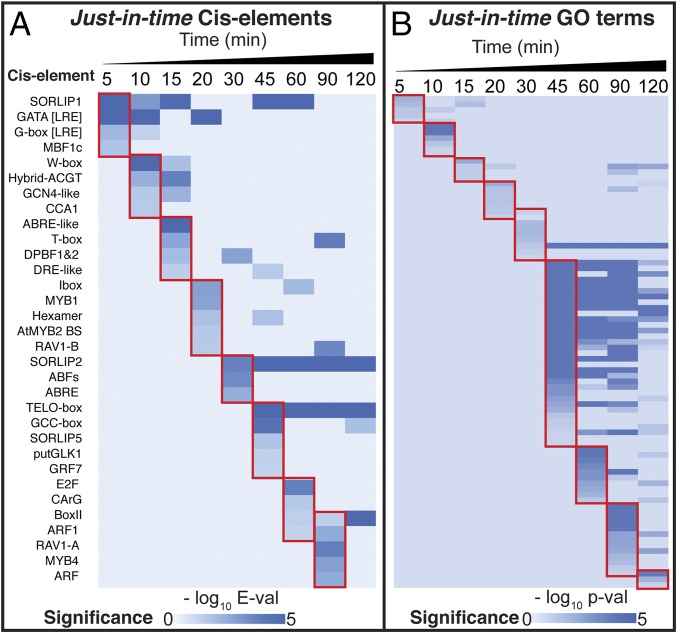
Fig. 1.
JIT gene set analysis identifies a temporal cascade of N-response genes in shoots. Genes responding to NxTime by cubic-spline analysis (23) were binned into the first time point at which mean expression changes by ≥1.5 fold (Methods and Dataset S1, Table S1). (A) A cascade of unique cis-element motifs are significantly enriched in each JIT gene set (Methods). (B) The JIT gene sets have nonoverlapping sets of GO terms enriched at each time point (Methods and SI Appendix, Fig. S2D).

