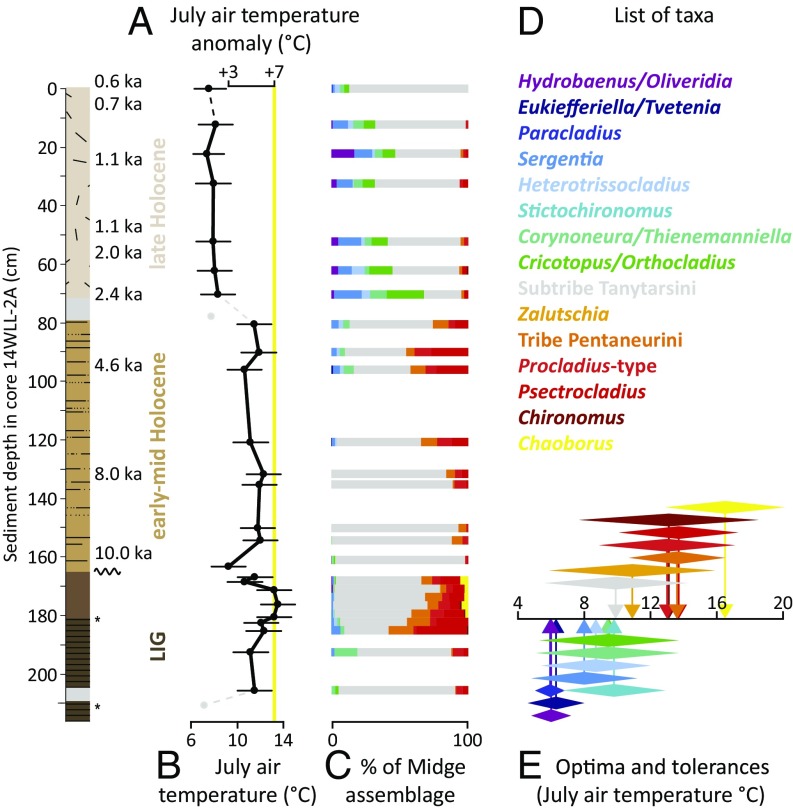
Fig. 3.
Midge-inferred July air temperature at WLL as (A) anomalies relative to modern and (B) absolute temperatures. Yellow line marks anomaly of +7.0 °C. Gray points indicate samples from discrete glaciolacustrine units where midge assemblages may not accurately reflect air temperatures (SI Appendix). Error bars are model root mean square error of prediction ±1.7 °C. (C) Percent of each midge type in subfossil assemblage, with colors corresponding to taxon names in D and modern optima and tolerances of taxa in the Francis et al. (35) training set, as shown in E. The apex of each diamond in E indicates optimum while length of diamond indicates tolerance.

