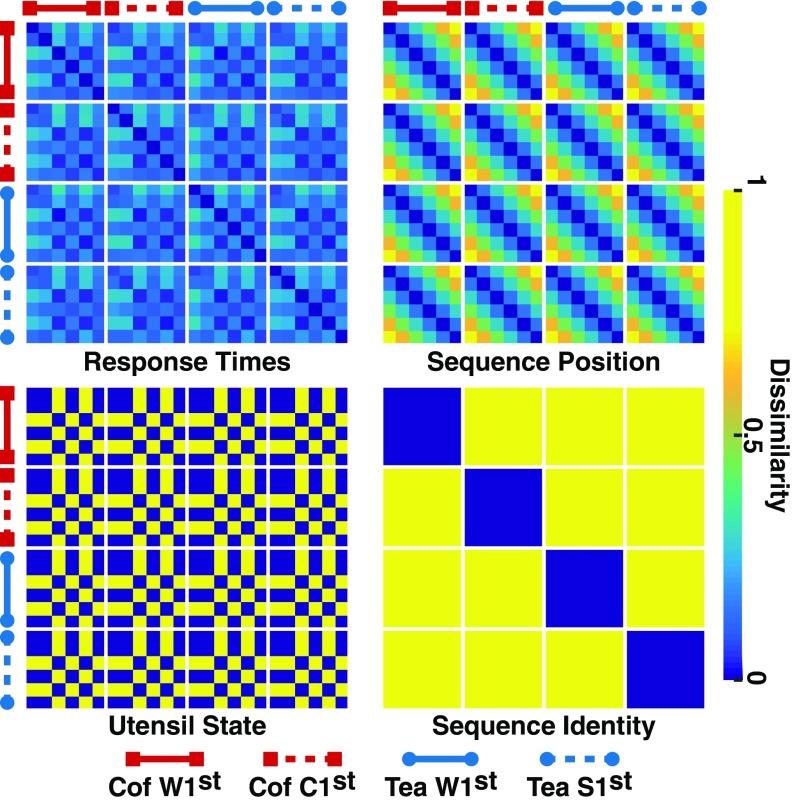
Fig. 5.
Representational dissimilarity matrices (RDMs) associated with follow-up analyses. Response times: RDM derived from the average response times of individual participants, averaged across subjects; lower values correspond to pairs of conditions with relatively similar average response times. Sequence position: sequence position RDM coding temporally distant states as dissimilar. Utensil state: utensil RDM discriminating utensil states from all other states. Sequence identity: sequence identity RDM discriminating within-sequence actions from across-sequence actions. The 24 states along each axis correspond to the six actions associated with each of the four task sequences [coffee (cof), water first; coffee, cream first; tea, water first; tea, sugar first; see Fig. 1B]. Blue indicates high similarity; yellow indicates low similarity. Units are arbitrary.

