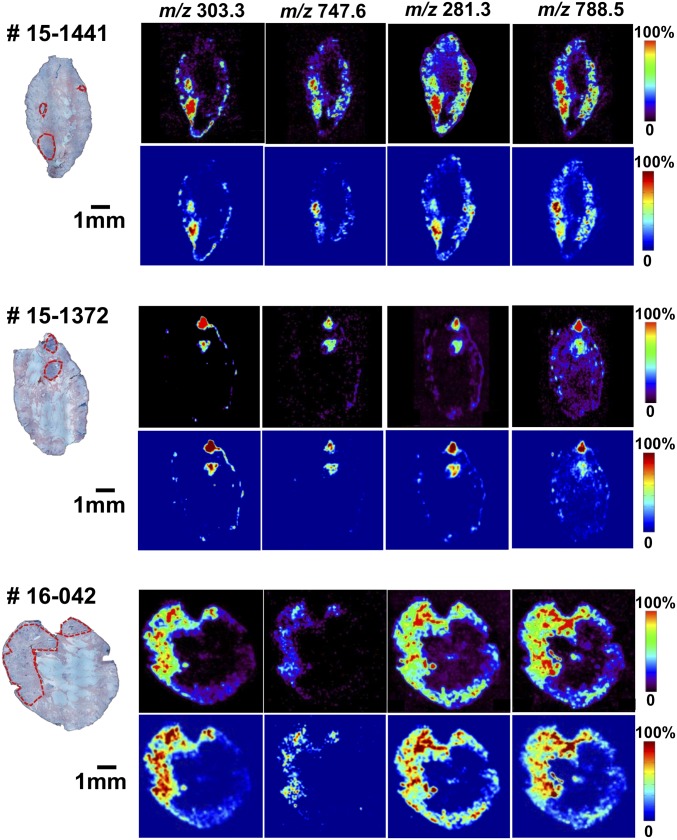
Fig. 3.
Selected 2D desorption electrospray ionization mass spectrometry (DESI-MS) images of molecular ion distribution for specimens #15-1441, #15-1372, and #16-042. Molecular ion distribution (Upper panel of each sample) is shown with normalization to a total ion current (Lower panel of each sample) to account for experimental variation between different measurements.

