Fig. 2.
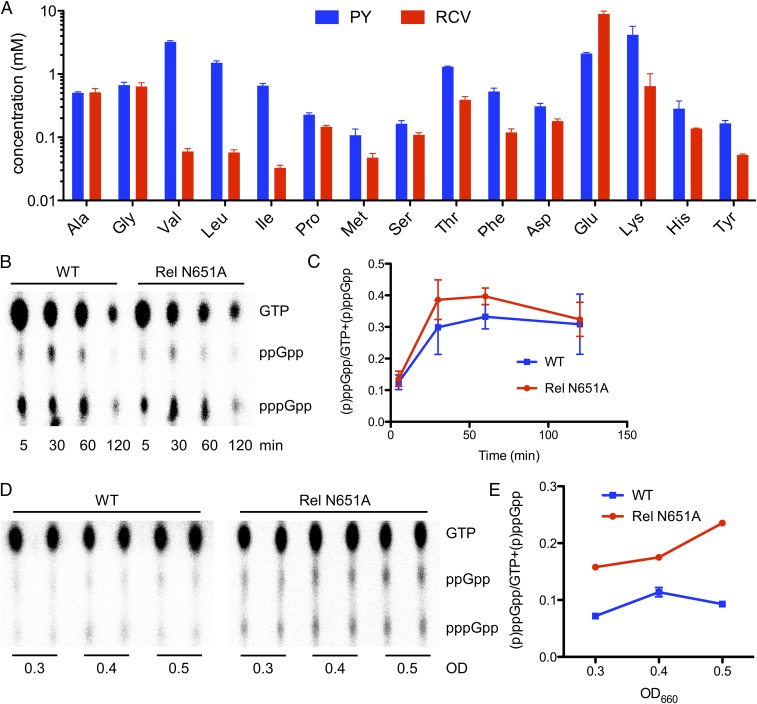
In vivo effect of BCAAs on alarmone levels. (A) In vivo amino acid concentrations in WT R. capsulatus grown in rich PY medium versus minimal RCV medium as measured by GC-MS. Data are represented as mean ± SEM (n = 3). (B) In vivo alarmone levels in WT and Rel N651A mutant R. capsulatus strains at different time points after a down shift from rich medium to minimum medium as revealed by TLC of 32P-labeled cell extracts. (C) Quantification of alarmone levels shown in B using ImageQuant software. Data are represented as mean ± SEM (n = 2). (D) In vivo alarmone levels in WT and Rel N651A mutant R. capsulatus at different OD660, as revealed by TLC of 32P-labeled cell extracts. (E) Quantification of alarmone levels in D using ImageQuant software. Data are represented as mean ± SEM (n = 2).

