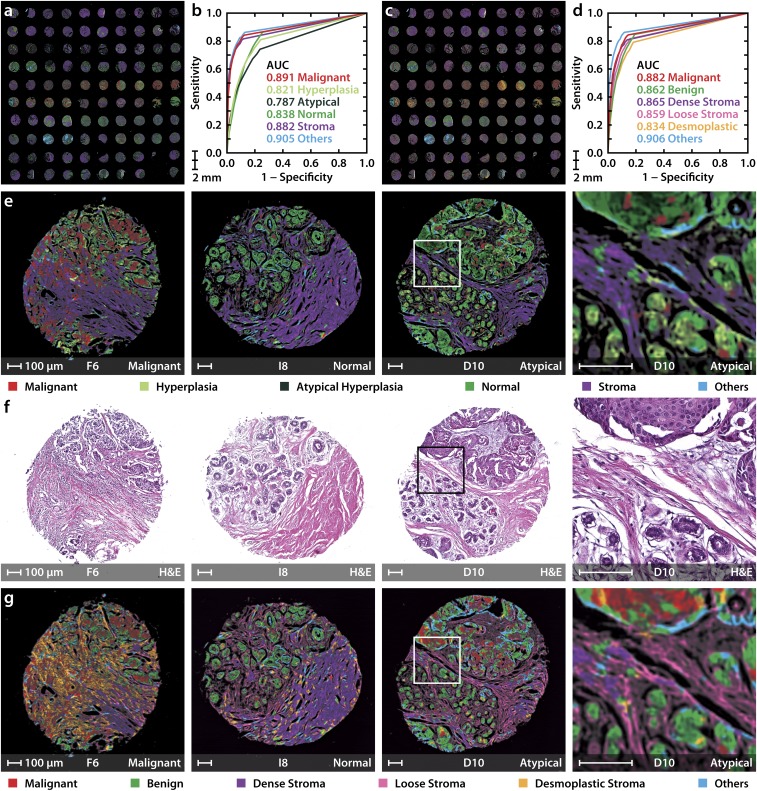
Fig. 4.
DF epithelial and stromal classification for rapid breast cancer diagnosis. (A) TMA classified using the 6-class epithelial (6E) model. (B) Receiver operating characteristic (ROC) curves represent the performance of each class in the 6E model. (C) TMA classified using the 6-class stromal (6S) differentiation model. (D) ROC curves for the 6S model. (E) 6E model classified images of three samples from the TMA with malignant, normal, and atypical hyperplasia states (Left to Right) along with their corresponding H&E-stained images in F. (G) Classification using the 6S model. A small region from the hyperplasia with atypia sample is also shown, along with its H&E stain, to demonstrate the spatial distribution of normal and malignant cells. The letter and numbers below each image correspond to the row and column of the TMA (A1 is the Top Left sample), respectively. All scale bars: 100 µm.

