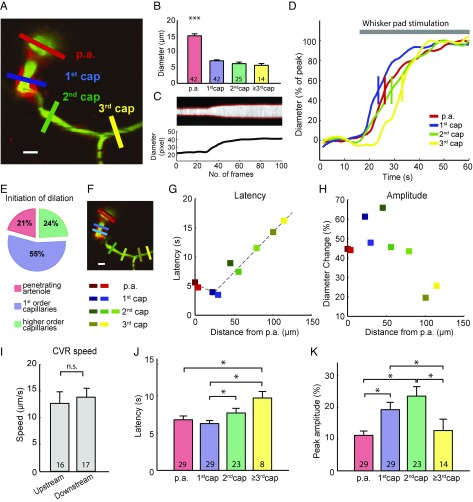
Fig. 1.
Functional vessel dilation in the mouse barrel cortex. (A) A two-photon image of the barrel cortex of a NG2-DsRed mouse at ∼150 µm depth. The p.a.s branch out a capillary horizontally (first order). Further branches are defined as second- and third-order capillaries. Pericytes are labeled with a red fluorophore (NG2-DsRed) and the vessel lumen with FITC-dextran (green). ROIs are placed across the vessel to allow measurement of the vessel diameter (colored bars). (Scale bar: 10 µm.) (B) Vessel diameters at different orders of capillaries. p.a., 15.09 ± 4.15 μm; 1st cap (first-order capillaries), 7.18 ± 1.93 μm; 2nd cap (second-order capillaries), 6.25 ± 2.43 μm; 3rd cap (third-order capillaries), 7.63 ± 2.47 μm. The p.a. diameter is significantly larger than all orders of capillaries. ***P < 0.001, one-way ANOVA with post hoc test. (C) Example trace of fluorescent intensity over time at the blue ROI in A is shown as the gray image, and the two red curves indicate the vessel wall (Upper). The distance of the two red curves is calculated as the time course of vessel diameter (Lower). (D) The normalized diameter change over time at different orders of capillaries in response to whisker-pad stimulation. The short vertical bar is where the curve reaches 50% peak, which is defined as response onset. (E) Distribution of the locations where the functional dilation initiated (n = 29 locations). (F) Multiple ROIs at the p.a. and first-, second-, and third-order capillaries are marked as red, blue, green, and yellow, respectively. (Scale bar: 10 µm.) (G) In this mouse experiment, the half-maximal dilation latency of each ROI is plotted with corresponding colors on the left along the geographic distance from the p.a. Dashed lines show the linear fit of the conducted dilation. (H) The maximal dilation amplitude is plotted with corresponding colors on the left along the geographic distance from the p.a. (I) Eighteen out of 29 imaged vasculatures exhibited conducted functional dilation, with an upstream conductive speed of 12.65 ± 0.96 µm/s and downstream conductive speed of 12.83 ± 0.64 µm/s. No significant difference was found between upstream and downstream conductive speeds. n.s., not significant; P > 0.05, unpaired t test. (J) Time to 50% maximal dilation was significantly longer in the third-order capillaries than the p.a. and first-order capillaries. The second-order capillaries dilated significantly slower than the first-order capillaries. *P < 0.05, one-way ANOVA with post hoc test. (K) Maximal dilation amplitude in different order capillaries. First- and second-order capillaries exhibited significantly larger responses than other locations. *P < 0.05, one-way ANOVA with post hoc test. All error bars represent SEM.

