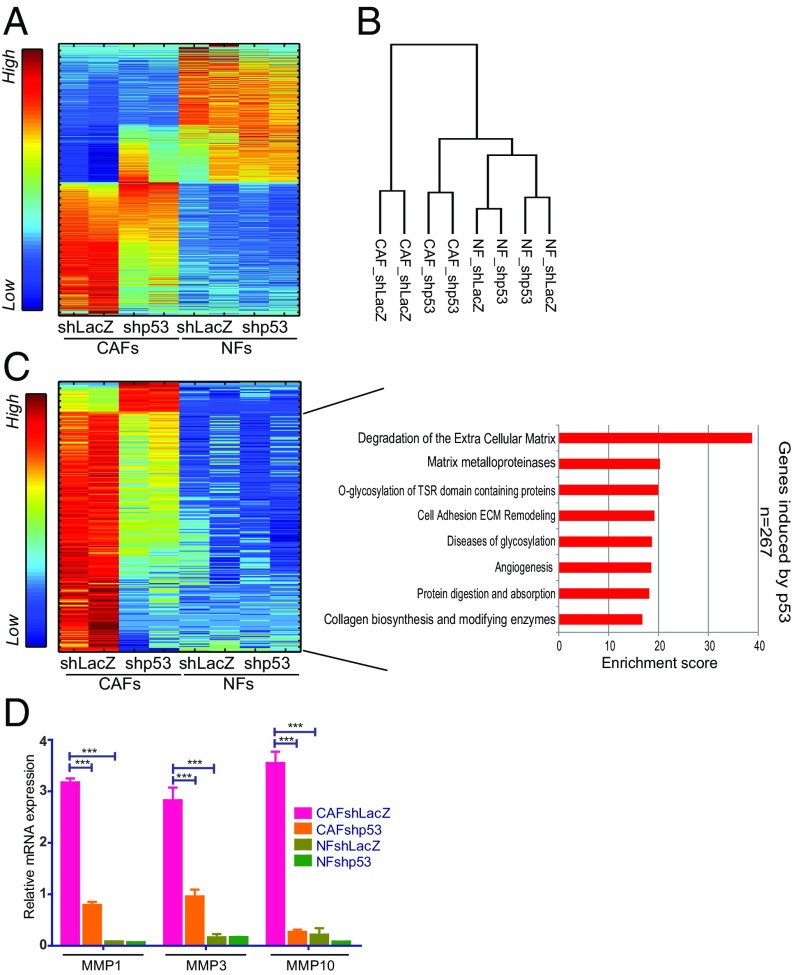
Fig. 3.
CAF p53 regulates genes associated with ECM remodeling. (A) SPIN-ordered expression matrix of genes differentially expressed between immortalized NFs and CAFs (patient 4731) (fold-change >1.5 and adjusted P value <0.05; 1,662 genes). Colors indicate relative expression after standardizing each gene (Left bar). (B) Dendrogram showing hierarchical clustering of data from transcriptome analysis of duplicate control and p53-depleted CAF and NF samples (average linkage, Pearson correlation). (C) p53-dependent genes in CAFs (fold-change >1.5 between shLacZ and shp53 in both replicates; 300 genes) were extracted from the set of genes more abundantly expressed in CAFs compared with NFs. Expression levels in both CAFs and NFs were visualized by SPIN-ordered expression matrix; colors indicate relative expression after standardizing each gene (Left bar). Pathway enrichment analysis (GeneAnalytics) for genes expressed preferentially and activated by p53 in CAFs is shown on the Right. (D) Quantification of MMP1, MMP3, and MMP10 mRNA from immortalized fibroblasts (patient 4731) by qRT-PCR. Values (mean ± SEM) were derived from five independent experiments. ***P ≤ 0.001 using one-way ANOVA and Tukey post hoc test. SPIN, sorting points into neighborhood; TSR, thrombospondin type I repeat.

