Fig. 5.
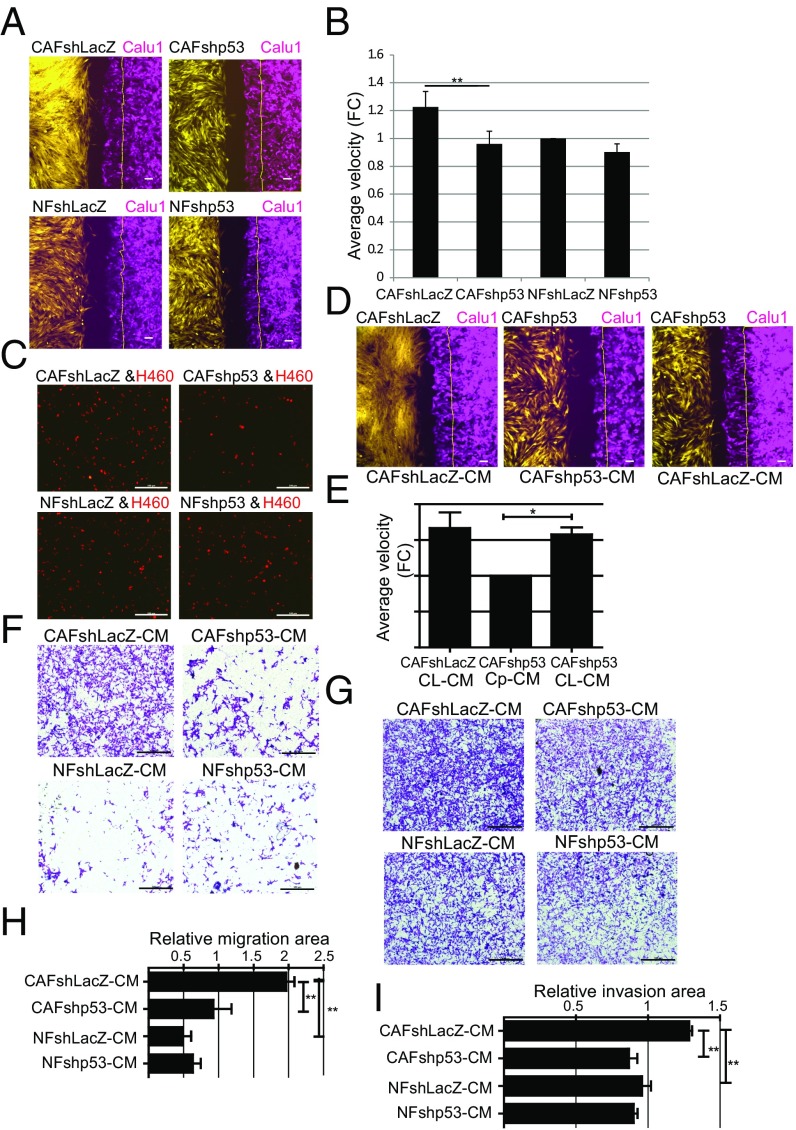
CAFs promote p53-dependent cancer cell migration and invasion. (A) GFP-expressing immortalized fibroblasts from patient 4731 (yellow) and mCherry-expressing Calu1 cells (magenta) were seeded in 12-well plates containing ibidi culture inserts. The next day, inserts were removed and cells were allowed to migrate. Shown are images snap-captured at 6 h. The thin yellow line on the right indicates the position of the Calu1 front at time = 0. (Scale bars, 100 μm.) (B) Average velocity of Calu1 migration toward the indicated fibroblasts, relative to migration of tumor cells alone, based on 6-h measurements. Values are means ± SEMs of three independent experiments, **P < 0.01. (C) mCherry-labeled H460 cells were seeded together with the indicated immortalized fibroblasts and subjected to a trans-well migration assay toward EGF. mCherry-positive cells that had migrated across the membrane were photographed 16 h later. (Scale bars, 500 μm.) (D) Live cell migration analysis as in A, except that cultures were supplemented with CM from the indicated fibroblasts (listed below the panel) after removal of the insert. (Scale bars, 100 μm.) (E) Average velocity of Calu1 cell migration toward the fibroblasts as assayed in D, relative to the CAFshp53-CM samples. CL-CM, CAFshLacZ-CM; Cp-CM, CAFshp53-CM. Values are means ± SEMs of three independent experiments, *P < 0.05. (F) Calu1 cells were grown in trans-well inserts, and the lower chamber was loaded with CM from the different indicated fibroblasts. Sixteen hours later, migrated cells were stained with crystal violet and photographed. (Scale bars, 500 μm.) (G) Calu1 cells were grown in Matrigel-coated trans-well inserts, and the lower chamber was loaded with CM from the different indicated fibroblasts. Twenty hours later, cells that had invaded across the membrane were stained with crystal violet and photographed. (Scale bars, 500 μm.) (H) Average migration ± SEMs from three independent experiments performed as in F; quantification is described in SI Appendix. **P < 0.01 using one-way ANOVA and Tukey post hoc test. (I) Average invasion ± SEMs from three independent experiments performed as in G, quantified as in H. **P < 0.01 using one-way ANOVA and Tukey post hoc test. FC, fold-change.

