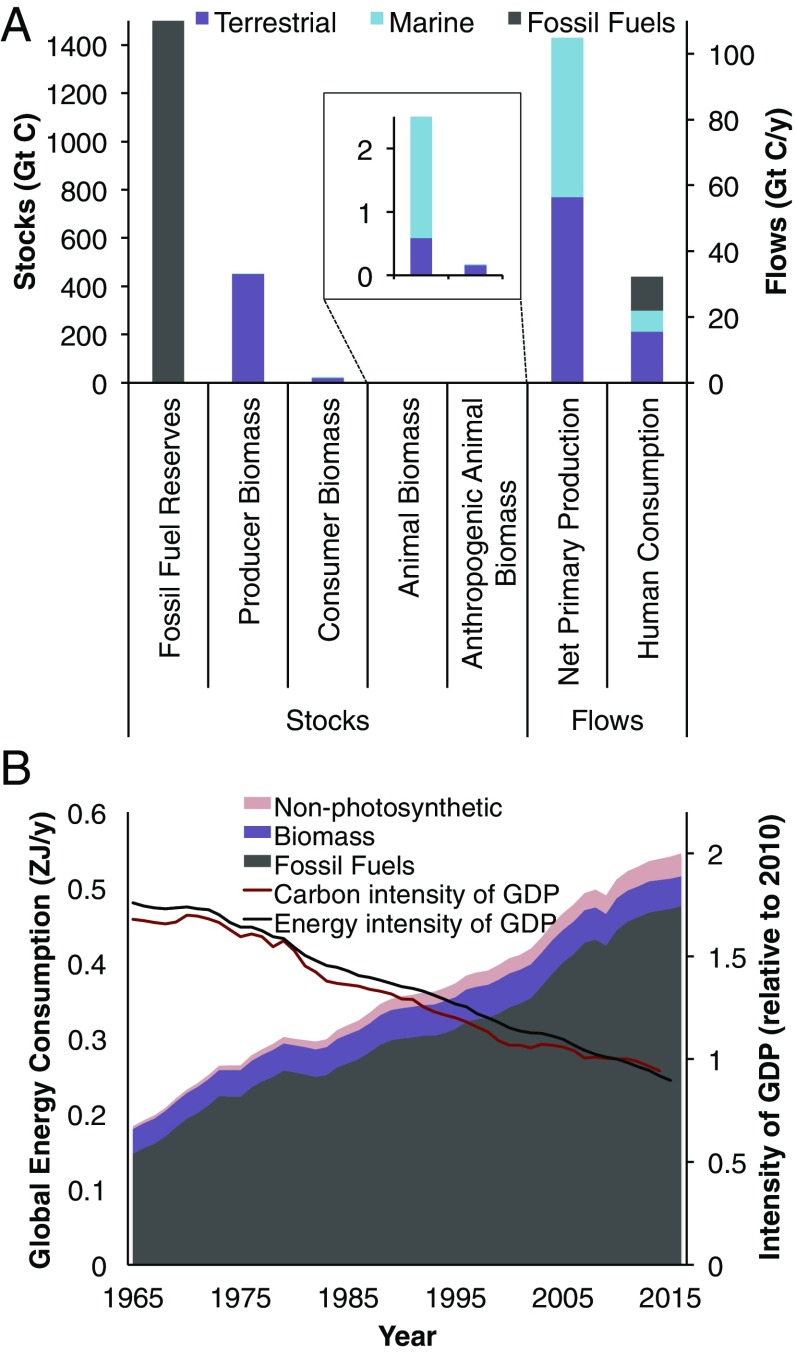
Fig. 1.
A compares scales of human and natural stocks and flows of carbon (data from refs. 1, 2, 11–13, and 18; see text for description). “Animal Biomass” includes both human and nonhuman biomass, from Bar-On et al.’s (1) table 1. “Anthropogenic Animal Biomass” is the subset including human biomass, livestock biomass, and animal aquaculture biomass. For fossil fuel reserves, 1,500 Gt C is shown, which is the midpoint of the IPCC’s approximate range (18). B shows the changes in energy consumption from photosynthetic (biomass and fossil fuels) and nonphotosynthetic (nuclear and renewables) sources over the last ∼50 y (data from ref. 16), as well as the carbon (from energy, cement production, and flaring) and energy intensities of the global economy (gigatons of CO2/2011 international dollars, and zettajoules/2011 international dollars, respectively; both shown as a fraction of their 2010 value) over the same period (data from refs. 16, 17, and 19).

