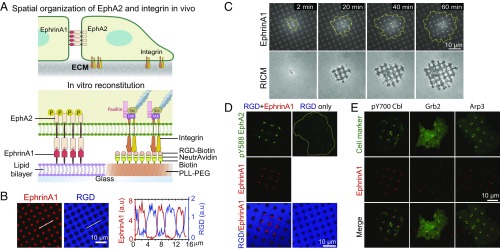
Fig. 1.
Spatially controlled activation of EphA2 and integrin on a micropatterned hybrid substrate of fluid ephrinA1 and immobilized RGD. (A) Schematic illustration of the in vivo spatial organization of EphA2 and integrin and the in vitro reconstitution system. (B) Hybrid substrate images (Left) and intensity line profile (Right). (C) Time-course images of a cell spreading on the hybrid substrate. Yellow lines mark cell outlines, and RICM stands for “reflection interference contrast microscopy” images. (D) Fluorescent images of pY588-EphA2 of cells fixed after spreading for 30 min. RGD-only refers to the hybrid substrate of RGD and SLB, and RGD+EphrinA1 refers to the same substrate but with ephrinA1 on SLB. Pearson’s correlation coefficient between pY588 EphA2 and ephrinA1 is 0.91 ± 0.05 (mean ± SEM). n = 5 cells. (E) Fluorescent images of different cellular proteins colocalized with ephrinA1 clusters. pY700-Cbl image is of a fixed cell that was immunostained after 60 min of spreading. Grb2-tdEOS and Arp3-mcherry are live-cell images after 60 min of spreading. Pearson’s correlation coefficients between pY700-Cbl, Grb2, and Arp3, and ephrinA1 signals are 0.52 ± 0.04, 0.87 ± 0.06, and 0.55 ± 0.05 (mean ± SEM) respectively. n = 5 cells.

