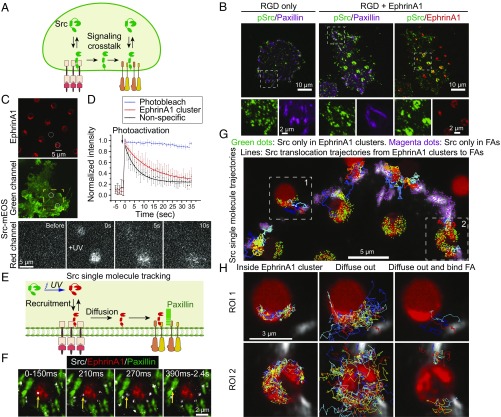
Fig. 5.
Src kinase is recruited and activated in EphA2 clusters and then diffuses into FAs. (A) Src mediates signaling cross talk between EphA2 and integrin receptors. (B) Immunofluorescence images of pY419-Src and paxillin in cells fixed after 1 h of spreading on indicated substrates. (C and D) Photoactivation of Src-mEOS3.2 on cells spread on an RGD+EphrinA1 substrate. (C) A localized UV (405-nm) pulse was applied to simultaneously photoactivate Src-mEOS3.2 in one region of ephrinA1 clusters and one nonspecific region in the same cell (white circles). Src-mEOS3.2 red channel was recorded before and after UV exposure (selected ROI by a yellow square). (D) Graph of normalized Src-mEOS3.2 red fluorescence intensities in the circular regions. Photobleach control was acquired from bulk plasma membrane measurement with the same imaging acquisition settings. n = 7. (E) Principles of Src-mEOS3.2 single-molecule tracking in cells with cotransfection of paxillin-GFP and spread on Alexa 680-labeled ephrinA1 substrate. (F) One example of Src single-molecule tracking showing translocation from ephrinA1 clusters to FAs. The Src single-molecule movie and static images of FAs and ephrinA1 are merged to reveal Src recruitment and diffusion. Yellow arrow indicates a Src single molecule, with indicated recording time from its first appearance. (G and H) Src single-molecule trajectories. (G) Src molecules are recruited both in ephrinA1 clusters and FAs, which then dissociate in the same location or diffuse away through membrane. Green dots represent the initial location of Src single molecules that first appear in ephrinA1 clusters and then disappear in the same region. Magenta dots represent the initial location of Src single molecules that first appear in FAs and then disappear in the same region. Trajectory lines represent Src translocation from ephrinA1 clusters to FAs. (H) High-resolution Src single-molecule trajectories in two representative ROIs in E. Src molecules that first appear in ephrinA1 cluster region are divided into two groups: always inside ephrinA1 clusters or later diffusing outside. Among those diffusing outside molecules, a subpopulation bind FAs.

