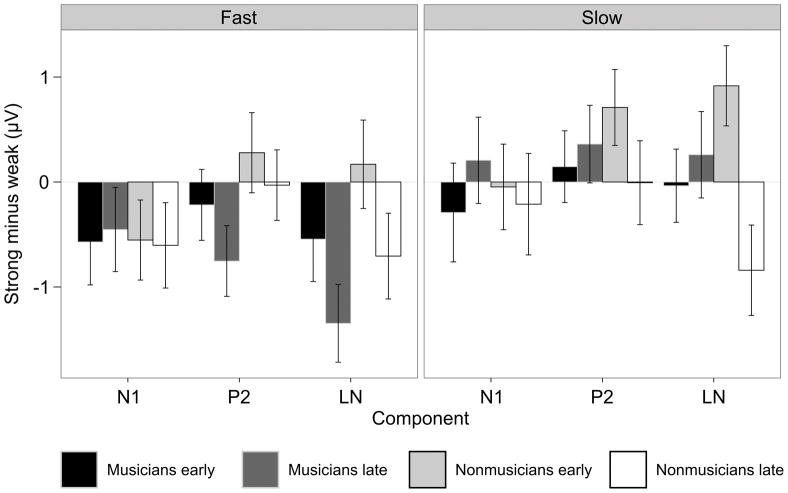
Figure 4.
Averaged ERP waveforms by group. Waveforms represent the averaged response to notes presented at metrically strong (black) and weak (grey) times, collapsing across tempi. Waveforms show averages within the nine scalp regions of interest included in statistical analyses. Grand averaged responses are shown separately for (a) musicians (n = 12) and (b) nonmusicians (n = 12).

