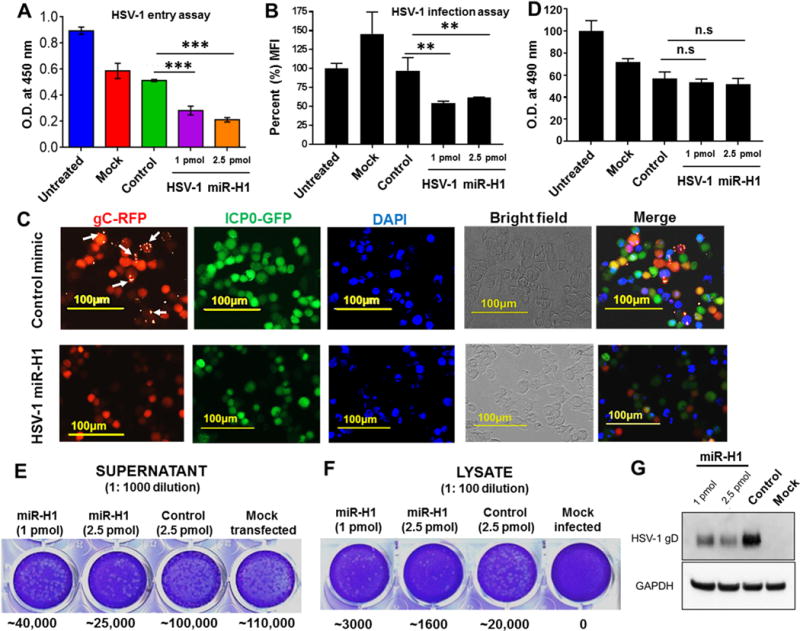
Figure 5.

miR-H1 control HSV-1 entry and infection in host cell. (A) HOK were transfected with miR-H1 mimic, control mimics or mock transfected. To examine the impact of miR-H1 on viral entry, cells were incubated HSV-1 (gL86) at 10 MOI. β-galactosidase activity was assayed by providing substrate (ONPG) 6 h.p.i. Histograms show absorbance (yellow color) at 450 nm quantified on a plate reader. (B) miR-H1 or control infected cells were assessed for productive infection using dual reporter expressing HSV-1 (KOS). After 24 hours, GFP (ICP0) florescence was measured by flow cytometric analysis. Geometric MFI (of GFP) were normalized with respect to untransfected cells and the percent values are shown as histograms. (C) Representative images showing florescent-tagged HSV-1 early (ICP0;GFP) and late (gC;RFP) proteins in miR-H1 or control mimic transfected cells. Scale bar:100μm. (D) Impact of v-miR or control mimic and HSV-1 (gL86) infection on the viability of HOK was evaluated by MTS assays. Histograms showing percent absorbance (at 490 nm) for untransfected, mock, miR-H1 or control mimics. Plaque assays show virion formation in the (E) supernatant and (F) lysates of HSV-1 infected HOK cells expressing miR-H1 or control mimic. Colony numbers are mentioned for each sample below corresponding well. (G) Immunoblot showing accumulation of late protein gD in the lysates of the same samples. GAPDH was used a loading control. Error bars represent mean ± SD from three biological replicates. P-values were calculated using Student’s t-test. **p<0.01; ***p<0.0001
