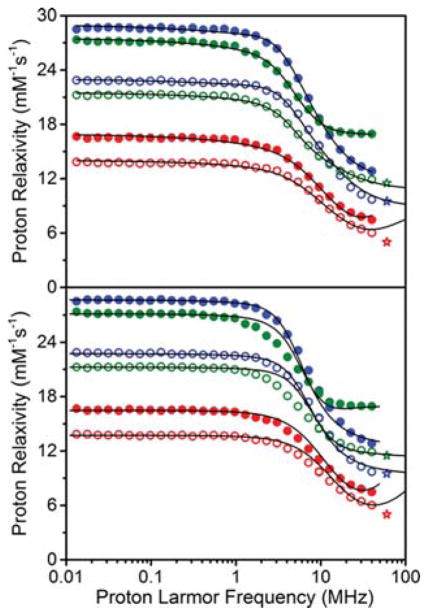
Figure 7.
Best fit NMRD profiles obtained in the assumption of anisotropic (top) or isotropic (bottom) reorientation time. Aqueous solutions of 1 (red), 2 (blue), and 3 (green). The corresponding red, blue, and green stars represent the relaxivity measured at 1.4 T reported above. Solid and hollow spheres represent data obtained at 25 and 37 °C respectively. Lines represent the best fits obtained from the minimization.

