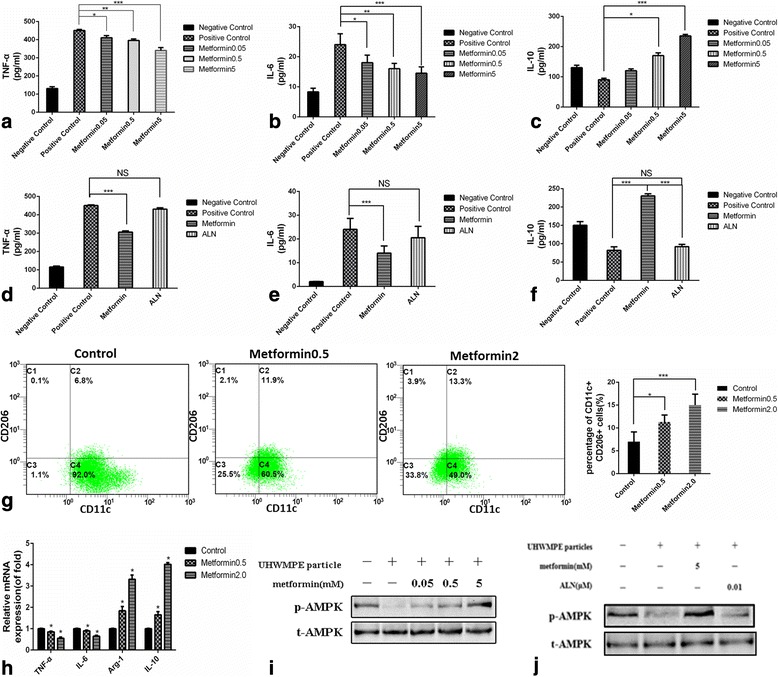
Fig. 1.

Effect of metformin on primary mouse BMM cytokine production in response to UHMWPE particles and the effect on AMPK phosphorylation. Concentrations of (a) TNF-α, (b) IL-6, and (c) IL-10 in culture media after exposure of the cells to UHMWPE particles and various concentrations (0.05, 0.5, or 5 mM) of metformin. Concentrations of (d) TNF-α, (e) IL-6, and (f) IL-10 in culture media after exposure of the cells to UHMWPE particles and 5 mM metformin as well as 0.01 μM ALN. g Flow cytometric analysis of control and metformin-treated groups. h QRT-PCR results for M1 marker mRNA expression and M2 marker mRNA expression. i–j Western blot results for phosphorylated AMPK (p-AMPK) and total AMPK (t-AMPK) in the different treatment groups. (Cropped gels/blots are used here, and the full-length gels and blots are shown in Additional file 1: Figure S3.) Data represent the means ± SD. NC, negative control (no treatment); PC, positive control (treatment with UHMWPE particles only). ***P < 0.001; **P < 0.01; *P < 0.05
