
Fig. 6.
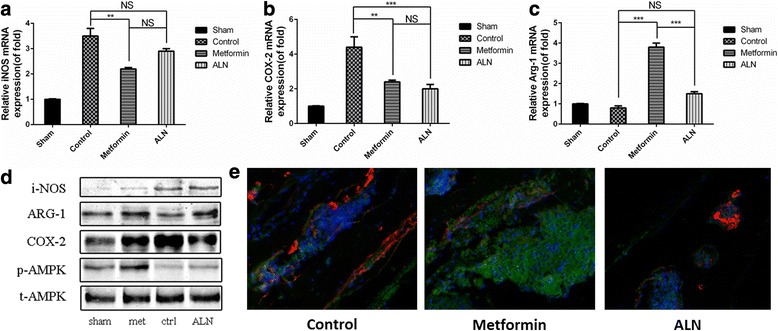
mRNA expression of proteins associated with macrophage phenotype and changes of protein expression according to western blot analysis in mouse calvarial tissue after implantation of UHMWPE particles and treatment with saline (control), metformin, or ALN. Relative mRNA expression of iNOS (a), COX-2 (b), and Arg-1 (c) among tissues from the different groups. d Protein expression of iNOS, COX-2, Arg-1, p-AMPK, and t-AMPK among tissues from the different treatment groups. e Double-labelling immunofluorescence of p-AMPK (green) and macrophage marker CD68 (red) in control group, metformin-treated group and ALN-treated group. (Cropped gels/blots are used here, and the full-length gels and blots are shown in Additional file 1: Figure S5.) ***P < 0.001; **P < 0.01; *P < 0.05; NS, P > 0.05