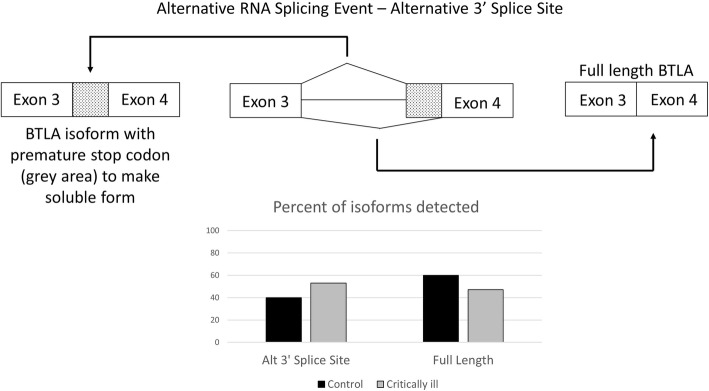
Fig. 3.
– Alternative 3’ Splice Site of BTLA: The percentage of an alternative 3′ splice site at exon 4 is significantly different between critically ill mice (40%, n = 3) and healthy controls (53%, n = 3) (FDR =0.0000429857901449, bar graph to the left). The full length isoform is seen 60% of the time in the control mice and 47% of the time in the critically ill mice (bar graph to the right)

