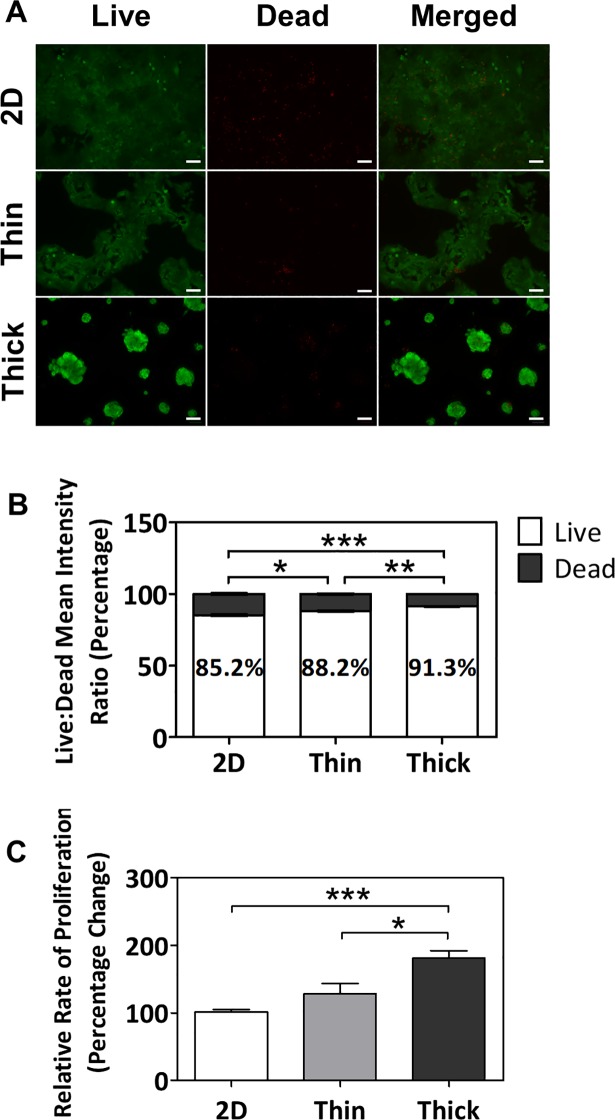
Fig 2. Thickness-dependent increases in cell viability and proliferation in BeWo cells cultured on Matrigel after 7 days.
(A) Immunofluorescent images of BeWo cells stained with Calcein AM (green) and Ethidium homodimer-1 (red). All images were taken at 10x objective magnification and scale bar indicates 100 μm. (B) Percentage ratio of mean intensities of live and dead cells cultured on 2D, thin, and thick surfaces. (C) Relative rates of proliferation of cells cultured on 2D, thin, and thick surfaces as assessed via MTS assay. Significant differences between treatment groups determined by one-way ANOVA followed by Tukey’s post-test; n ≥ 3. Significant differences between means determined by post-tests were indicated by * (p<0.05), ** (p<0.01), or *** (p<0.001).

