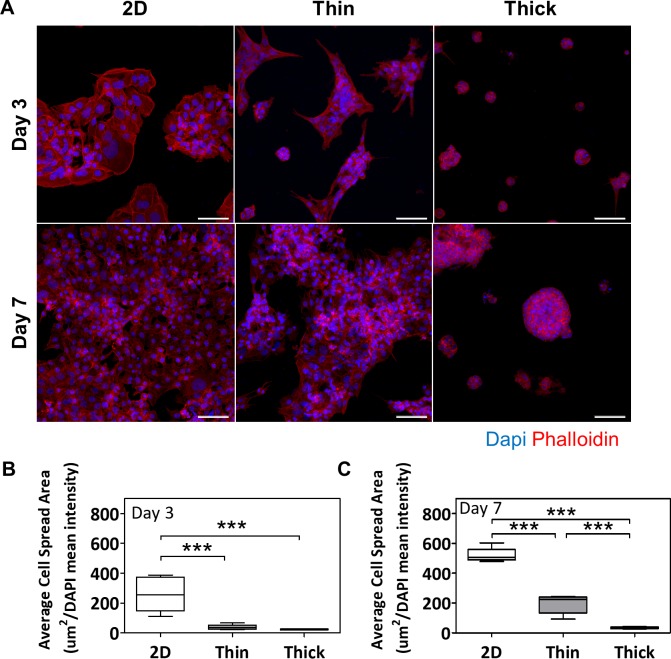
Fig 6. Thick Matrigel leads to decreased F-actin cell spread areas.
(A) Immunofluorescent images of Phalloidin staining at days 3 and 7 across various surface thicknesses. Red fluorescence indicates phalloidin staining for F-actin and blue fluorescence indicates DAPI staining for cell nuclei. Images were taken at 20x magnification and scale bar indicates 100 μm. Average cell spread areas as determined by quantifying the normalized binary area of phalloidin stain at (B) day 3 and (C) day 7. Significant differences between treatment groups determined by one-way ANOVA followed by Tukey’s post-test; n = 3. Significant differences between means determined by post-tests were indicated by *** (p<0.001).

