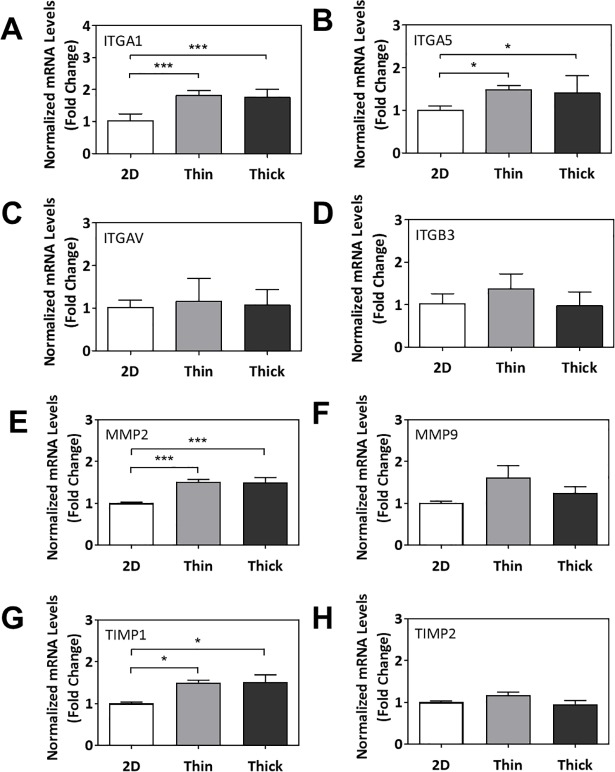
Fig 7. Gene expression profiling of cellular stiffness response to ECM surface thickness.
Normalized mRNA levels of (A) ITGA1, (B) ITGA5, (C) ITGAV, (D) ITGB3, (E) MMP2, (F) MMP9, (G) TIMP1, and (H) TIMP2. Significant differences between treatment groups determined by one-way ANOVA followed by Tukey’s post-test; n≥3. Significant differences between means determined by post-tests were indicated by * (p<0.05), ** (p<0.01), or *** (p<0.001).

