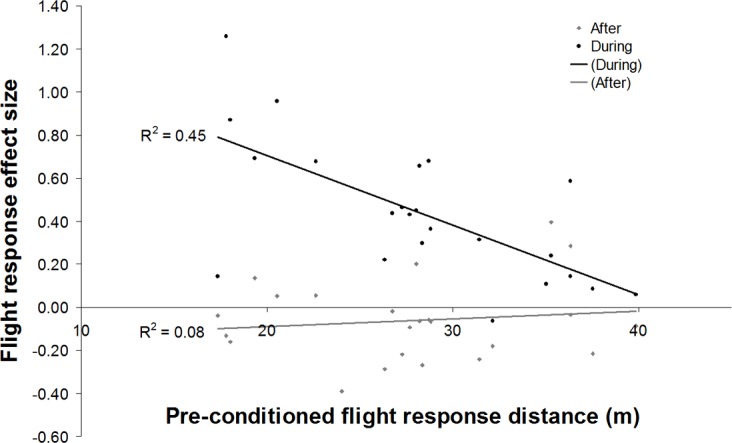
Fig 4. Effect of habituation, measured as the average flight response distance measured before conditioning (X-axis).

Effect sizes (Y-axis) are for changes in mean flight response distances during aversive conditioning and after conditioning stopped.
