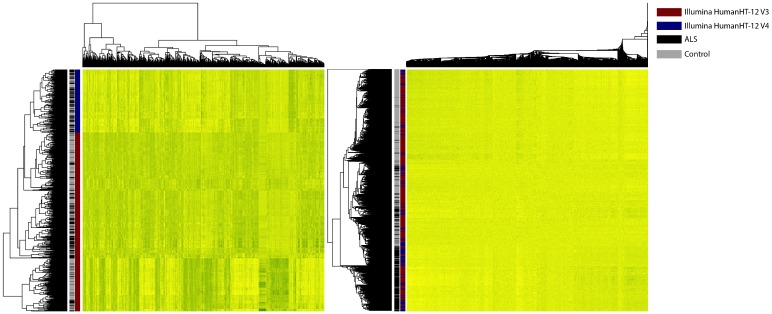
Fig 2. Elimination of expression heterogeneity by surrogate variable analysis.
The left heatmap displays the expression of the 5,000 most variable probes before correction by surrogate variable analysis. The right heatmap displays the expression of the 5,000 probes after correction by surrogate variable analysis. Rows display arrays and columns reflect probes. Arrays are clustered by hierarchical clustering. Black lines reflect patients and grey lines control subject. Red lines display array hybridized on Illumina’s HumanHT-12 version 3 BeadChips and blue lines those hybridized on version 4. Before SVA correction, arrays are perfectly clustered based on the platform used: after SVA correction, these batch effects are corrected for.

