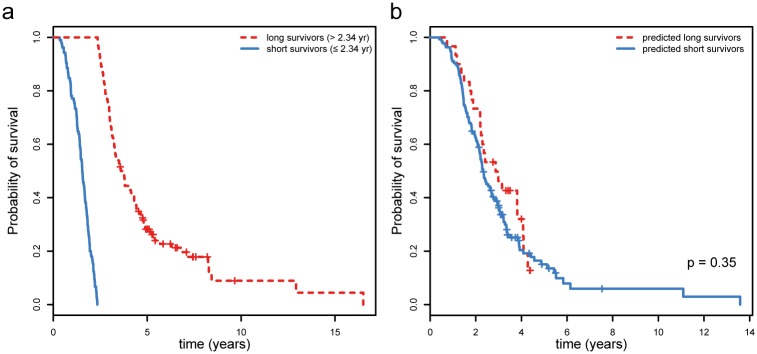
Fig 5. Survival curves for predicted survival classes.
(a) Differences in survival time for the so-termed “long survivors” and “short survivors” in the training set, which was used as input to train the nearest shrunken centroid survival model. (b) The differences in true survival between the predicted “long survivors” and predicted “short survivors” in the test set.

