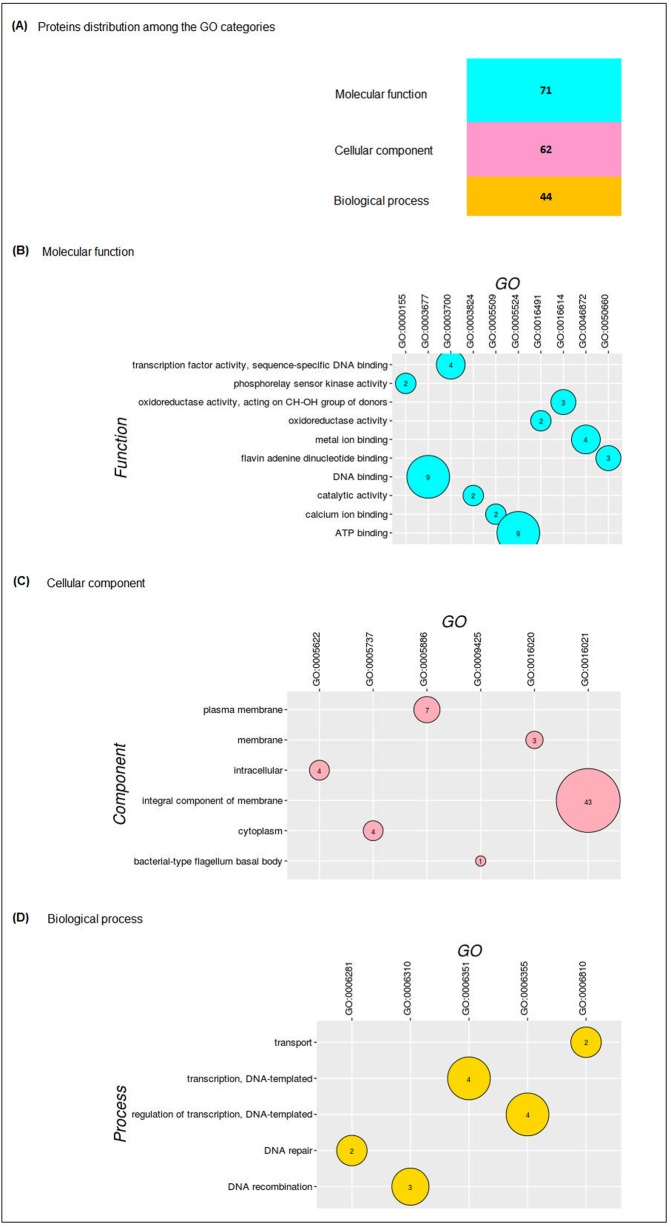
Fig 2. Distribution of the hypothetical proteins of E. antarcticum B7 among the GO categories.
(A) The figure shows how the HPs were distributed among the three gene ontology categories determined by the GoFeat software. (B) Graph of the molecular functions. (C) Graph of the cellular components. (D) Graph of the biological processes.

