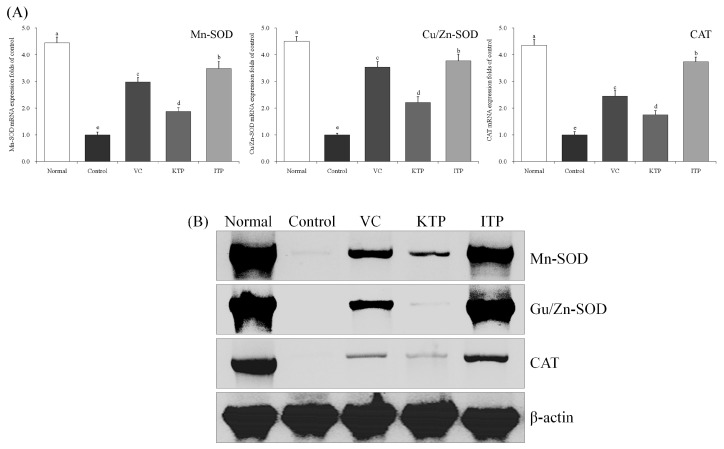
Figure 7.
Expression of mRNA (A) and protein (B) for Mn-SOD, Cu/Zn-SOD and CAT in spleen of mice. a–e Mean values with different letters in the same bar represent significant differences (p < 0.05) according to Duncan’s multiple-range test. VC: vitamin C (200 mg/kg body weight); KTP: Kuding tea polyphenols (200 mg/kg body weight); ITP: insect tea polyphenols (200 mg/kg body weight).

