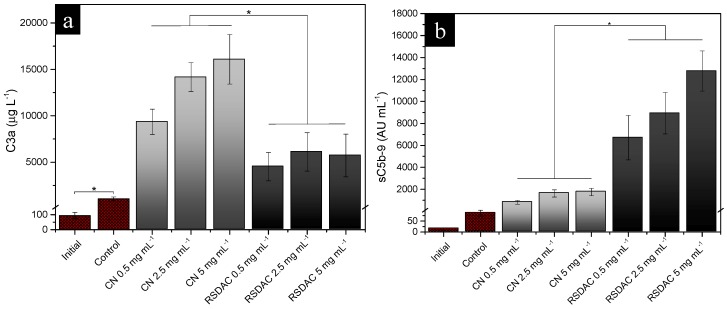
Figure 4.
Levels of: (a) C3a; (b) sC5b-9 complexes after whole blood incubation with Cladophora nanocellulose (CN) and RSDAC at 37 °C for 60 min. Data represent mean ± standard error of the mean for n = 8. Statistically significant differences between sample groups are indicated by * (p < 0.05). All Cladophora nanocellulose and RSDAC values were significantly different from the initial sample and control.

