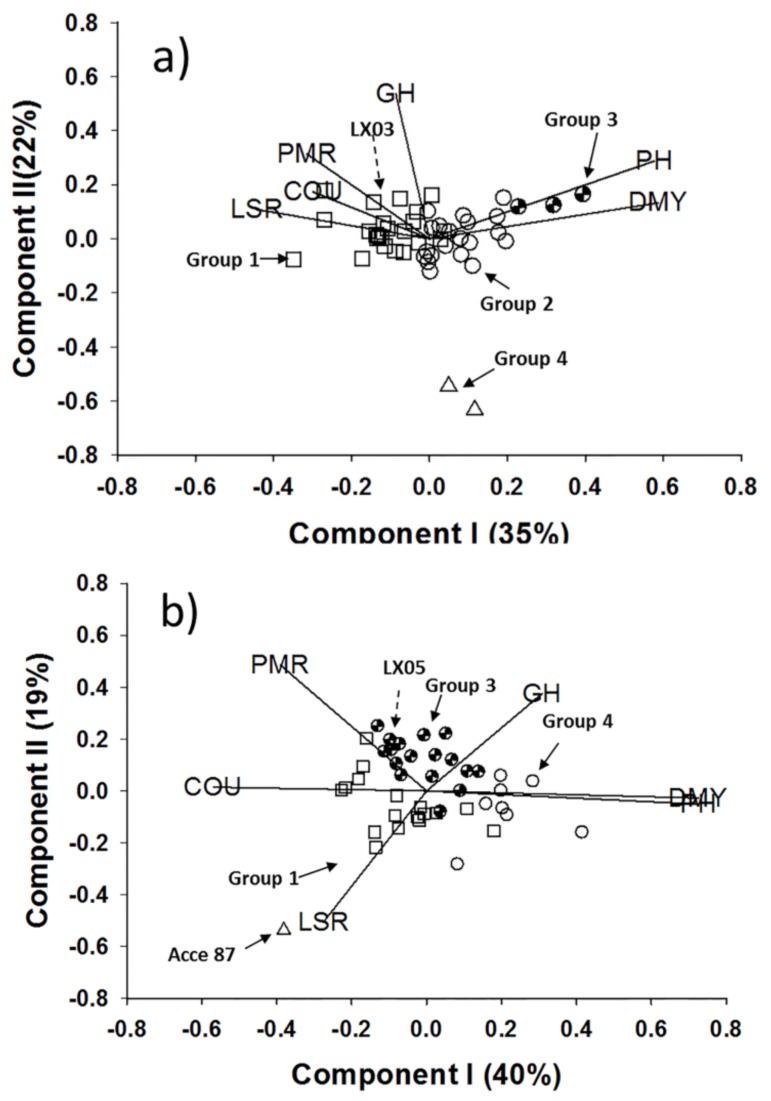
Figure 2.
Biplots generated using the accession-by-trait matrix approach for the six traits. PH, plant height; DMY, dry matter yield; LSR, leaf:stem ratio; Cou, coumarin content; and PMR, powdery mildew resistance, measured for (a) M. officinalis accessions and (b) M. albus accessions. In each biplot, the variation along components I and II is expressed as a percentage. The different symbols indicate the accession groups generated from the cluster analysis. The two local commercial lines LX03 and LX05 are indicated. The vectors represent the six traits.

