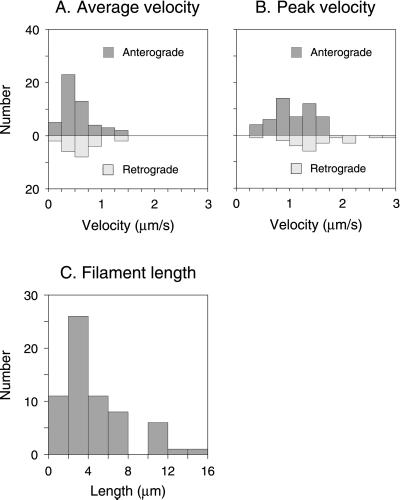
Figure 5.
Velocities and lengths of moving filaments. (A) A histogram of average velocities (excluding pauses) for all 72 filaments that moved. A filament was considered to have paused if it moved less than one pixel per second (0.0685 μm/s), which we estimate to be the precision limit of our measurements. (B) A histogram of peak velocities for all 72 filaments that moved. Peak velocity is defined as the maximum velocity attained in a single time-lapse interval. (C) The lengths of 64 filaments that moved. The other six filaments that moved could not be measured because both ends were never visible in the same image.

