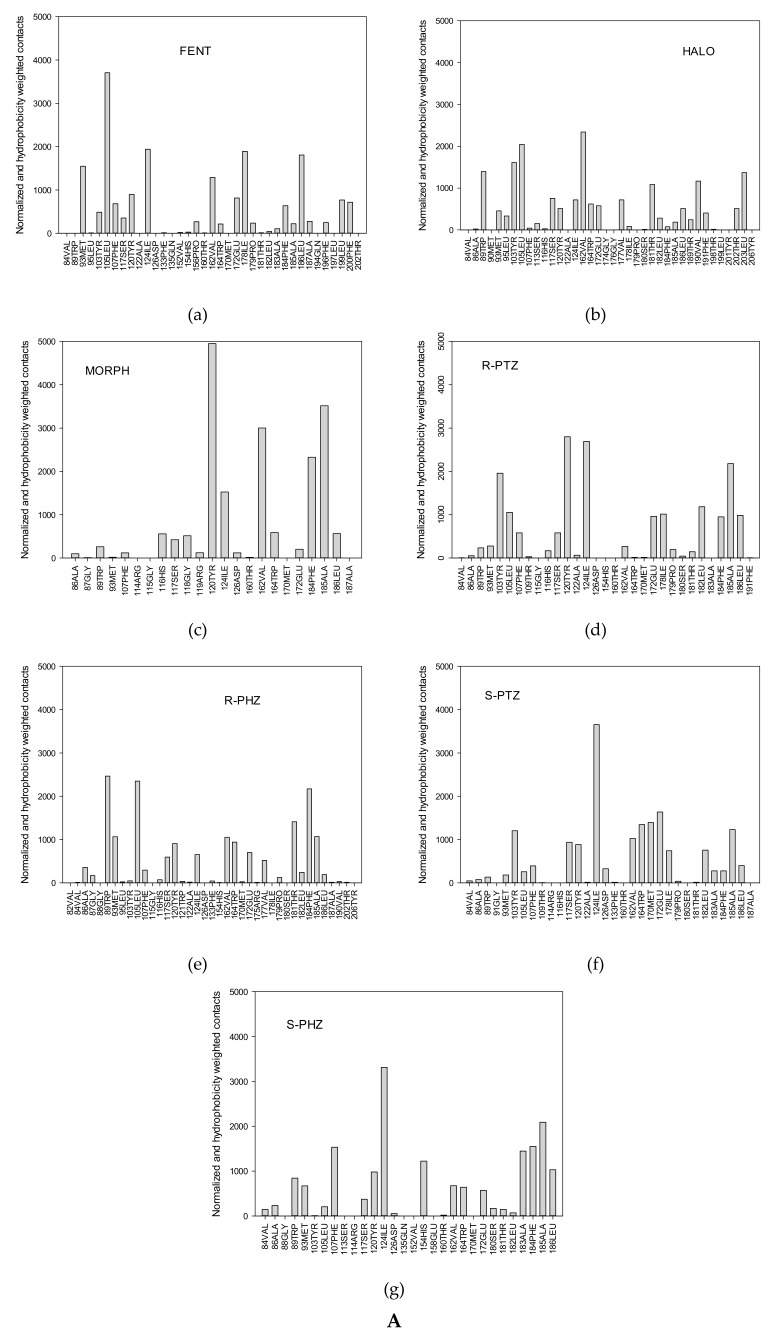
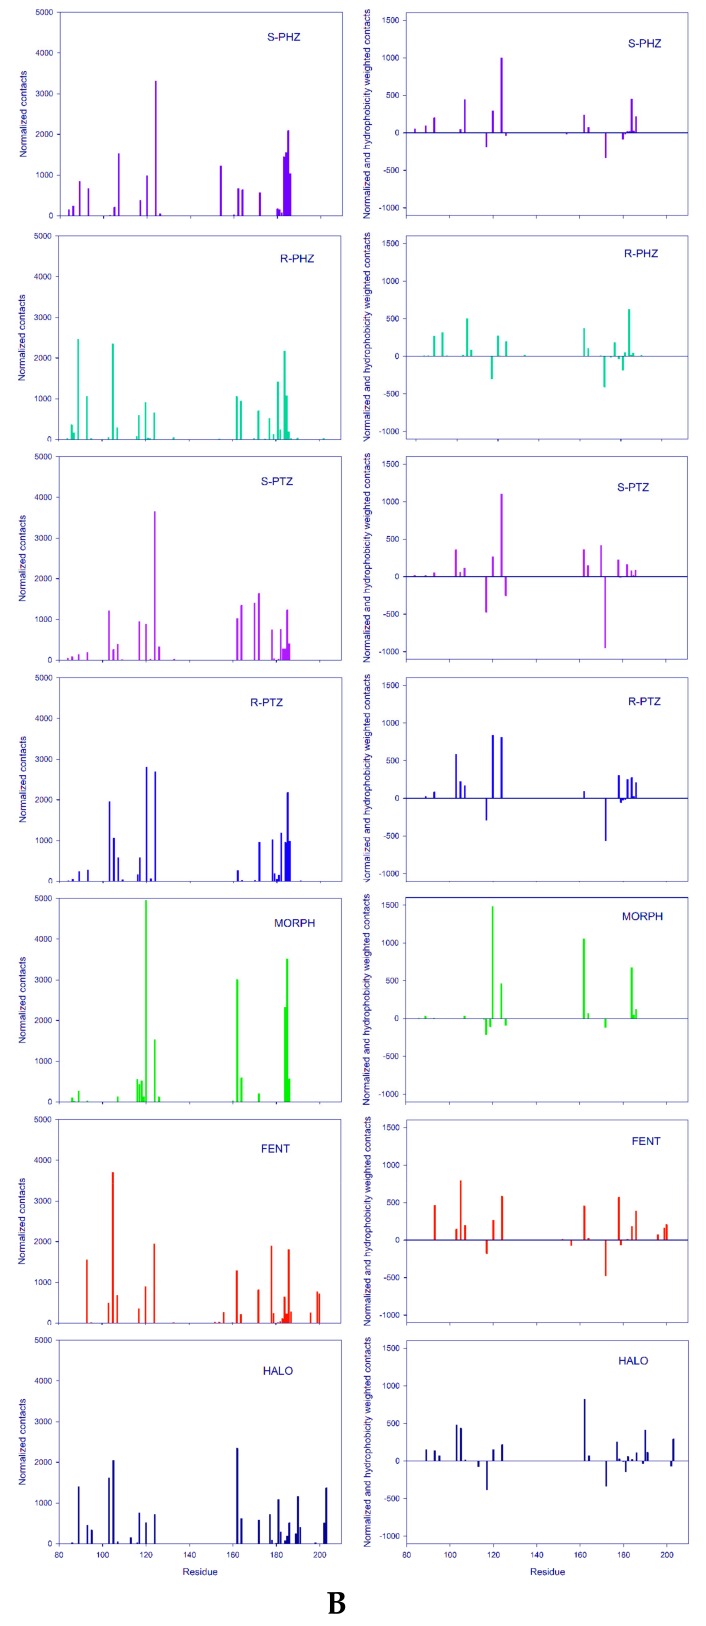
Figure 4.
(A) (a–g) Normalized spectrum of the frequency of the contacts between receptor residues and the ligands; (B) On the left: Normalized spectrum of the frequency of the contacts between receptor residues and the ligands. On the right: Spectrum of the frequency of ligand contacts with receptor residues normalized according to the hydrophobic scale taken from Reference [46]. The positive bars correspond to hydrophobic contacts while negative bars correspond to hydrophilic contacts.


