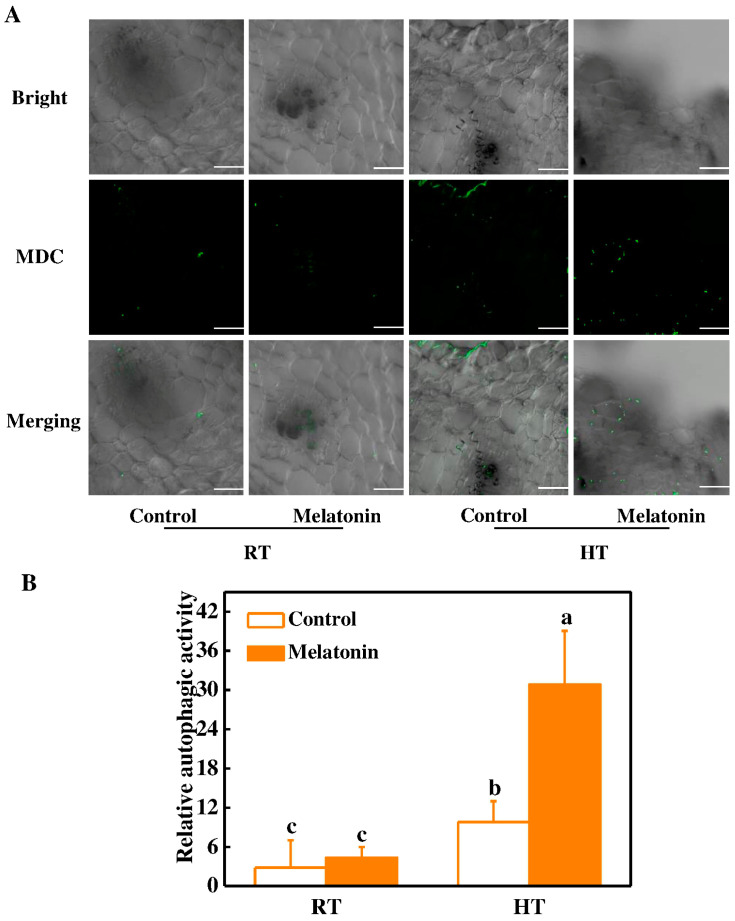
Figure 7.
Visualization of the accumulation of autophagosomes in tomato anthers after 3 h high temperature stress. (A) MDC-stained autophagosomes in the anthers. The anthers were stained with MDC and visualized by confocal microscopy. MDC-stained autophagosomes were shown as green signals, just as indicated with white arrows. Bars = 25 μm; (B) Relative autophagic activity normalized to the activity of the control plants in (A). The MDC-stained autophagosomes in the anthers at each treatment were quantified to calculate the autophagic activity relative to control plants, which was set to 1. More than 300 mesophyll cells for each treatment were used for the quantification. Mel, melatonin pretreatment. The data shown are the average of four replicates, with the standard errors shown by vertical bars. Means denoted by the same letter did not significantly differ at p < 0.05, according to Tukey’s test.

