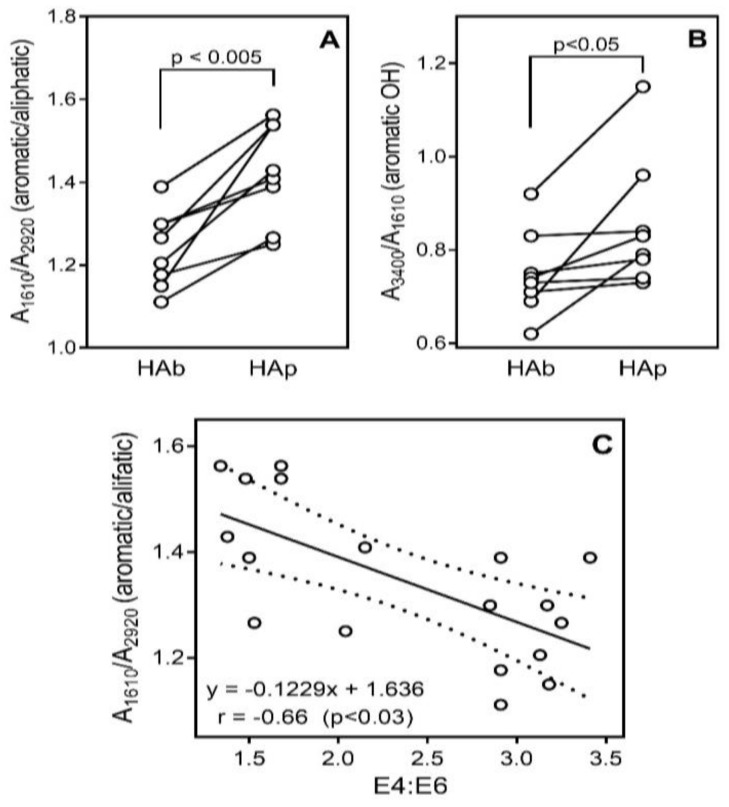
Figure 1.
Relative concentrations of functional groups in HA fractions estimated as a ratio of intensity of the absorption bands in the IR region. A1610, A2920, and A3400 are optical densities for aromatic (C=C), aliphatic, and OH groups, respectively. (Panels A,B) show differences in the ratios of the absorption bands between HAb and HAp fractions. (Panel C) shows a plot of A1610/A2920 versus E4:E6 for all 18 HA fractions. Dashed lines indicate area of the 95% confidence band.

