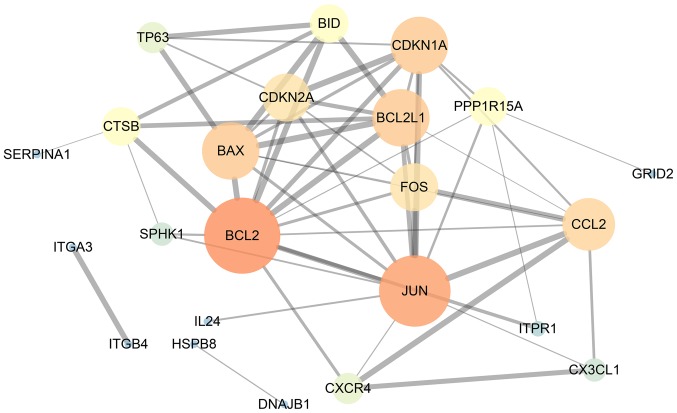
Figure 4.
Protein-protein interaction network of the differentially expressed autophagy-related genes. The size of the circles represents the weight of the gene in the network. A greater size indicates a greater weight. The thickness of the lines displays the connection score between two genes. The combined score is computed by combining the probabilities from the different evidence channels. A higher score indicates a closer tie.

