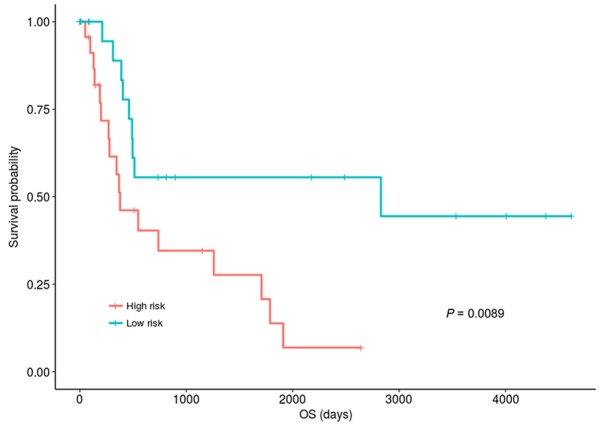
Figure 3.
Kaplan-Meier plot of OS for the low- and high-risk group in the validation dataset. Samples were divided into hypermethylation group and hypomethylation according to the median of the CAP-Gly domain containing linker protein family member 4 methylation values. A risk assessment system was established and patients in hypermethylation group were divided into high- and low-risk groups according to median risk score. The prognosis of the patients in the low-risk group was significantly better than those in the high-risk group. OS, overall survival.

