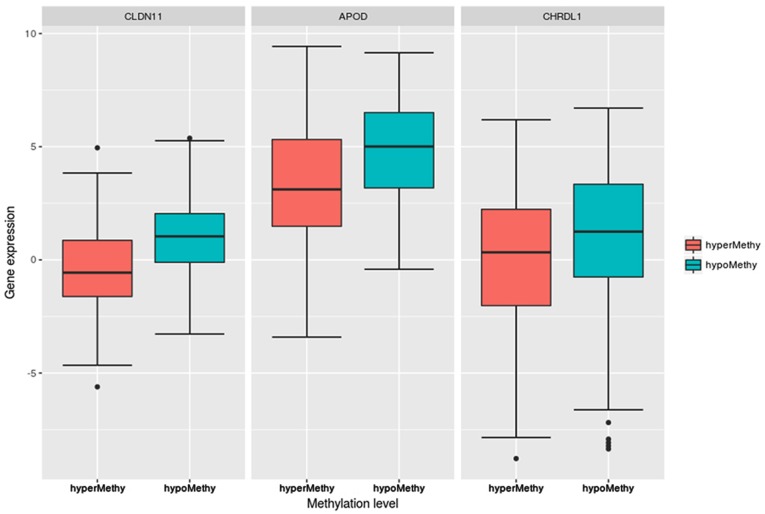
Figure 4.
Boxplots of the CLDN11, APOD and CHRDL1 expression levels in the hypomethylation and hypermethylation groups. The expression levels of the three genes in the hypermethylation group were significantly lower than those in the hypomethylation group: CLDN11 (P=1.09×10⁻¹³), APOD (P=4.12×10⁻⁸), and CHRDL1 (P=1.28×10⁻³). CLDN11, claudin 11; APOD, apolipoprotein D; CHRDL1, chordin like 1.

