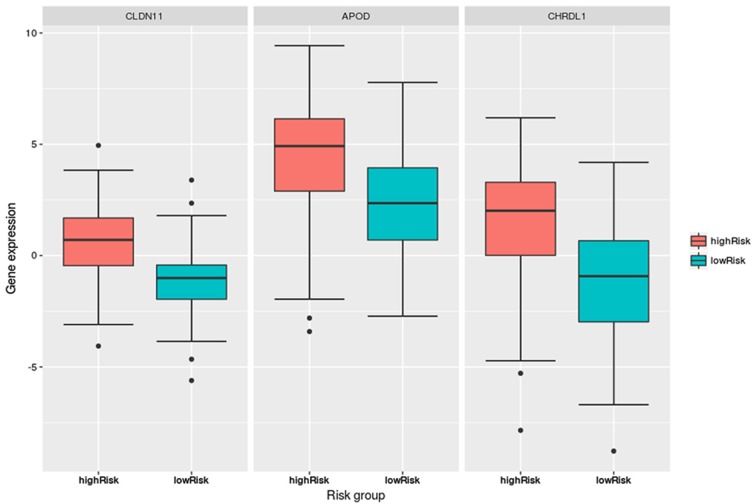
Figure 5.
Boxplots of the CLDN11, APOD and CHRDL1 expression levels in the low- and high-risk groups. The expression levels of the three genes were significantly different between the high- and low-risk groups: CLDN11 (P=1.48×10⁻¹⁰), APOD (P=1.71×10⁻⁶) and CHRDL1 (P=2.17×10⁻⁸). CLDN11, claudin 11; APOD, apolipoprotein D; CHRDL1, chordin like 1.

