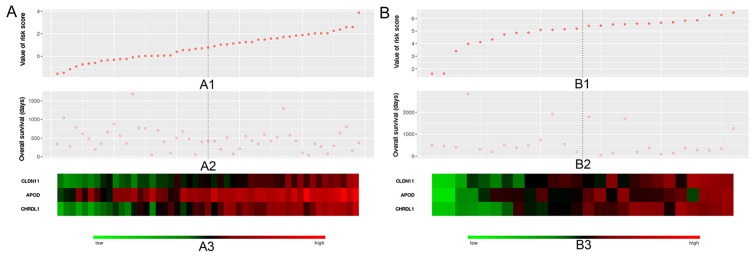
Figure 6.
Distribution of risk score, overall survival and gene expression in the (A) training and (B) validation datasets. A1 and B1 indicate the gradually rising trend in patient corresponding risk values in the training and validation datasets, respectively. A2 and B2 show the corresponding overall survival of patients. A3 and B3 indicate the expression levels of these three genes in patients, where the transition from green to red represents the increase in gene expression levels. CLDN11, claudin 11; APOD, apolipoprotein D; CHRDL1, chordin like 1.

