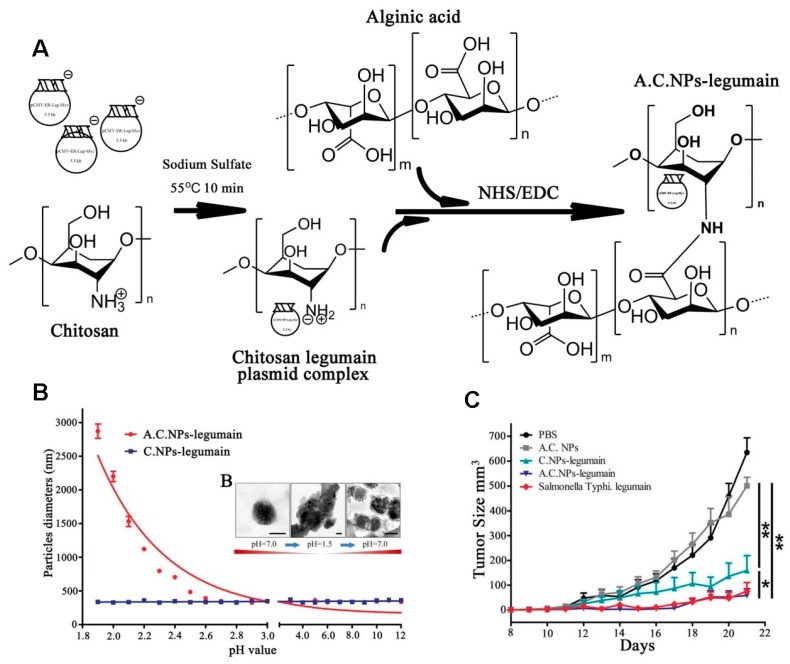
Figure 18.
(A) Illustration of AC NPs-legumain synthesis; (B) Nanoparticles were treated in different acidity levels (pH 1.8, 12) for 2 h: A C NPs-legumain and A C NPs-legumain particle diameter and zeta potential measurements at 37 °C; (C) Tumor growth curves. Data are presented as mean ± SD (* p < 0.05, ** p < 0.01) [65].

