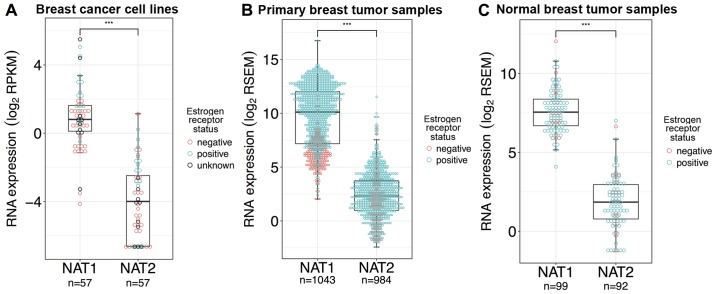
Figure 2.
NAT1 and NAT2 RNA expression in breast cancer cell lines, primary breast tumor samples, and normal breast tissue samples. Differences in gene expression between NAT1 and NAT2 in breast cancer cell lines, primary breast tumor tissue and normal breast tissue were statistically evaluated by Wilcoxon rank-sum test; ***P<0.001. Each dot represents a single sample and is color-coded according to ER status; pink dots, ER− samples; blue dots, ER+ samples; black dots, samples with unknown ER status. In the boxplots, the solid black line represents the median, the upper hinge represents the 75th quartile and the lower hinge represents the 25th quartile. The upper whisker represents the largest observation less than or equal to the upper hinge + 1.5 x IQR, the lower whisker represents the smallest observation greater than or equal to the lower hinge - 1.5 x IQR. (A) NAT1 RNA expression was significantly higher than NAT2 RNA expression in the breast cancer cell lines. (B) NAT1 RNA expression was significantly higher than NAT2 RNA expression in the primary breast tumor samples. (C) NAT1 RNA expression was significantly higher than NAT2 RNA expression in the normal breast tissue samples. ER, estrogen receptor; IQR, interquartile range; NAT1, arylamine N-acetyltransferase 1; NAT2, arylamine N-acetyltransferase 2; RPKM, reads per kilobase of transcript per million mapped reads; RSEM, RNA-Seq by Expectation-Maximization.

