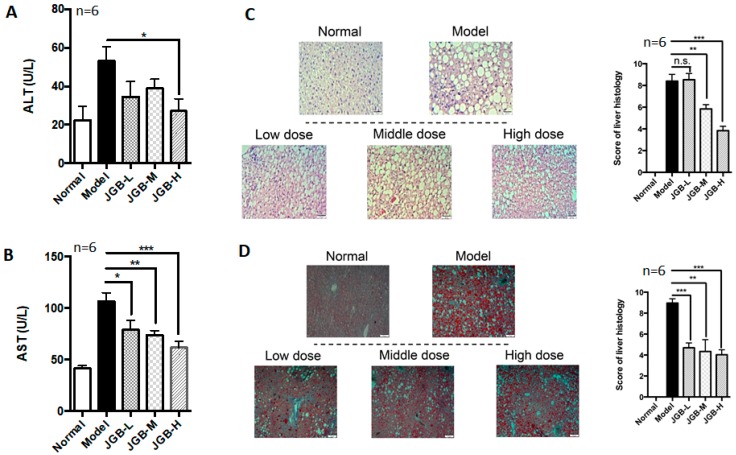
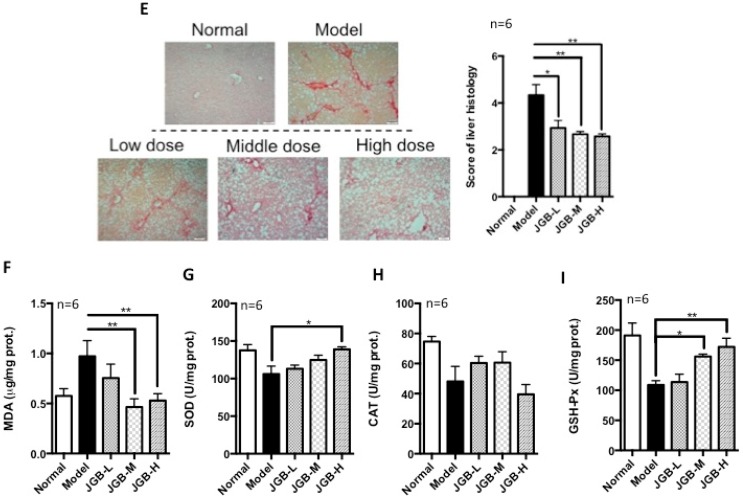
Figure 4.
The effect of JGB on non-alcoholic fatty liver disease combined with CCl4 fibrosis. (A) Serum ALT levels of mice from different groups; (B) Serum AST levels of mice from different groups; (C) H&E staining images and scoring of liver histology of mice from different groups; (D) Oil-red O staining images and scoring of liver histology of mice from different groups; (E) Picrosirius-red staining images and scoring of liver histology of mice from different groups; (F) MDA levels in liver of mice from different groups; (G) SOD levels of mice from different groups; (H) CAT levels of mice from different groups; (I) GSH-Px levels of mice from different groups. (JGB-L: JGB-low dose group, JGB-M: JGB-middle group, JGB-H: JGB-high group). Three biological replicates were performed for each study. * p < 0.05, ** p < 0.01, *** p < 0.001 when compared with model group.


