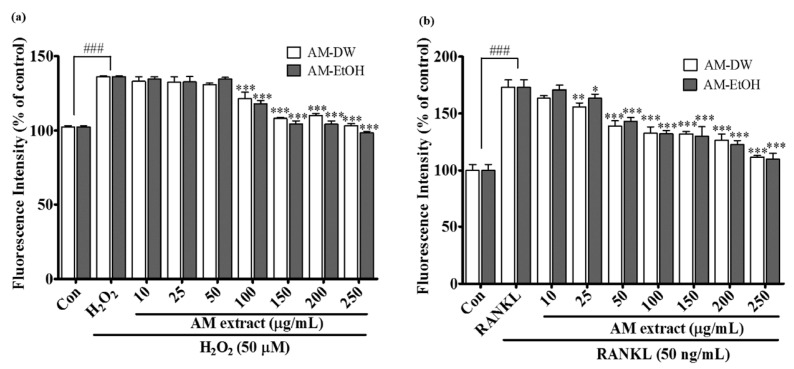
Figure 3.
Effects of AM extracts on ROS inhibition. (a) Inhibition of H2O2 induced ROS generation in RAW 264.7 cells by AM extracts; (b) Inhibition of RANKL induced ROS generation in RAW 264.7 cells by AM extracts. After 24 h of sample treatment 10 μM of H2DCF-DA was added to the cell and incubated for 40 min, following addition of 50 μM H2O2 or, 50 ng/mL RANKL for 1 h. All data are presented as the mean ± SD of three independent experiments performed with n = 3. Compared positive control (not treated group) vs. negative control (only H2O2 or RANKL treated group ### p < 0.001) and negative control vs. sample treated group (* p < 0.05, ** p < 0.01, *** p < 0.001).

